
Steel plate: line defects and dents hidden under scale stains, told apart by shape
 kotai2003
We imaged a steel plate whose surface was widely covered with dark stains — adhered scale and discoloration — on the TR-300. The sample was provided by a customer, who had marked three line defects and two dents in advance. We compared how each one appears in the ordinary image (LIVE) and in an image that carries shape only (3D Surface).
All figures below were measured on the raw data, before any brightness adjustment for display.
Stains do not appear in the shape image
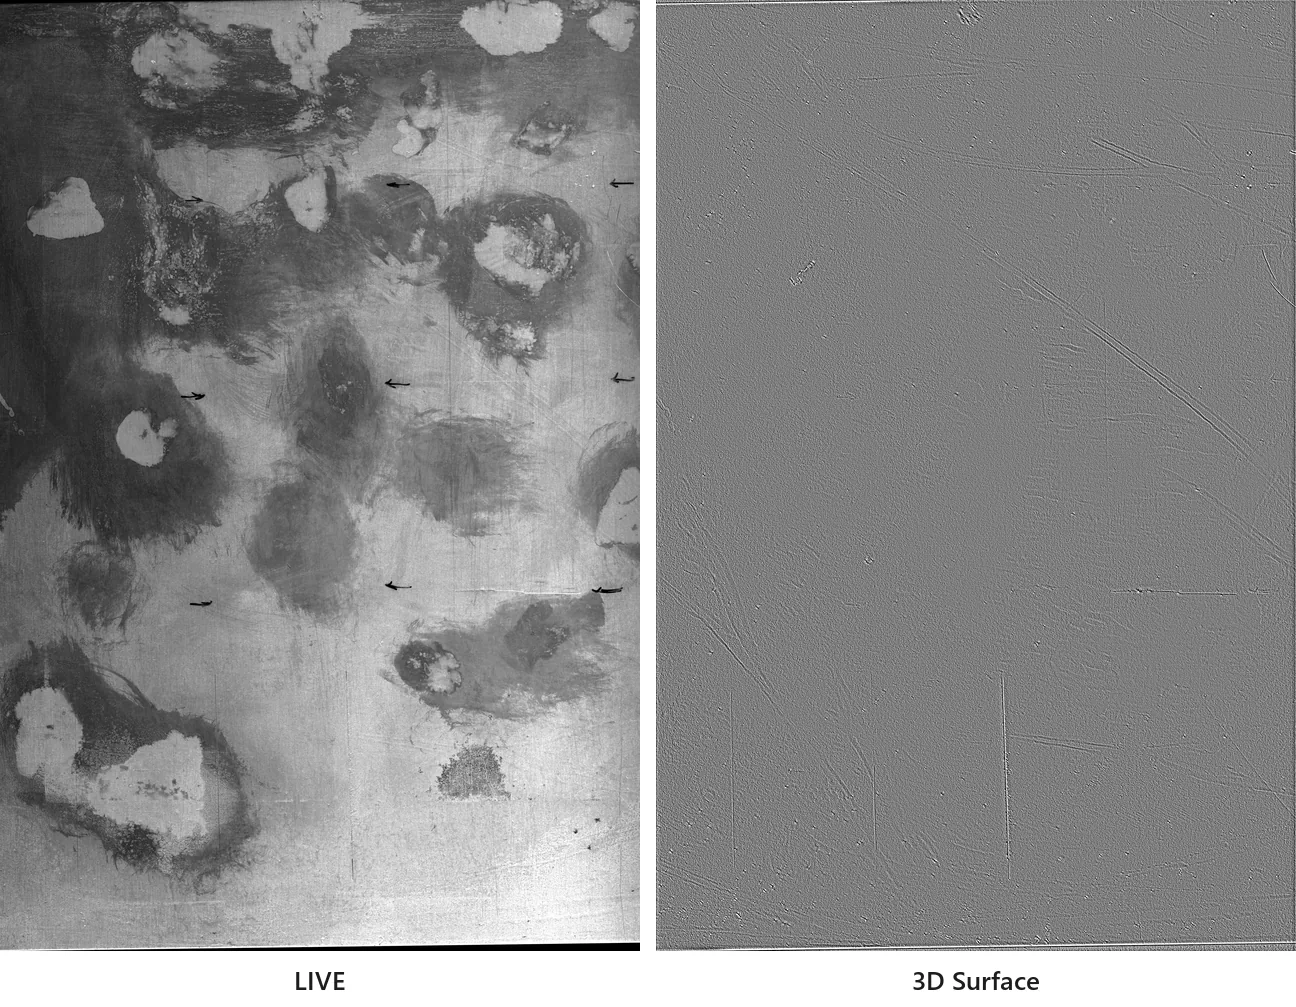
In LIVE, the most prominent features are not the defects but the dark stains. In 3D Surface, the stains disappear without a trace — and so do the ink arrows drawn to mark the defect locations.
The brightness difference between stained and clean areas was 66.4% in LIVE and 0.2% in 3D Surface. The stains are a change of color only; they carry no relief.
For inspection that looks for defects as differences in brightness, stains like these are a source of false detections. An image that sees shape does not record them in the first place.
A shallow scratch appears with about 12× the amplitude
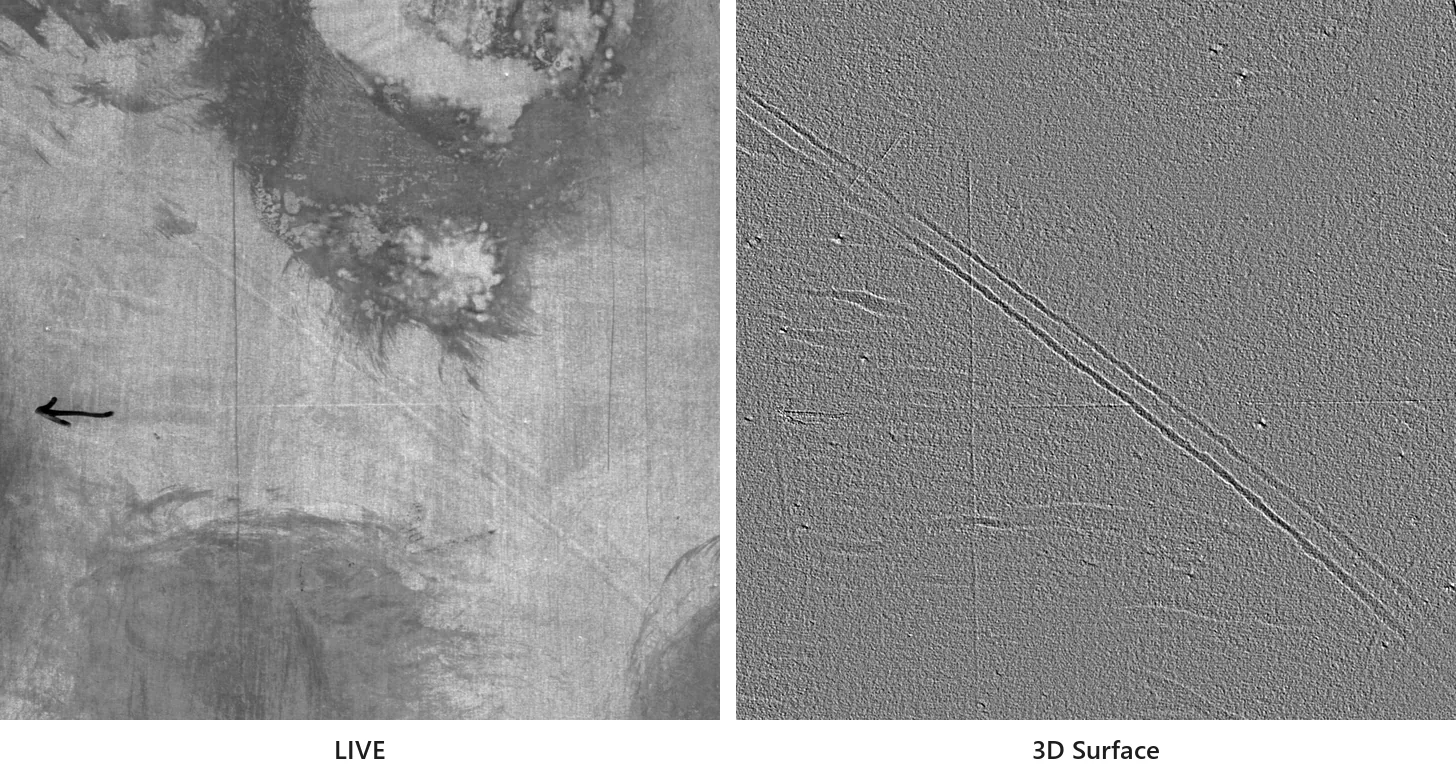
Defect ① is a shallow scratch made of two parallel lines. In LIVE its amplitude relative to the background is only 1.7%, and it is almost impossible to pick out from behind the stains. In 3D Surface it rises to 21.3% — about 12 times higher. You can see that it is two separate lines, and that it grows shallower toward one end.
Dents do not show up as color
The dents (④ and ⑤) are broad, gentle depressions. Because they barely change color or brightness, they are buried in background variation in LIVE (SNR 2.6 and 2.9). In 3D Surface the SNR was 6.7 and 7.0, clearly separated from the background.
Because the depressions are so gentle, they are not striking to the eye even in 3D Surface. Still, their SNR is more than twice that in LIVE — as a signal, they stand clearly apart from the background.
Some defects are clearer in LIVE
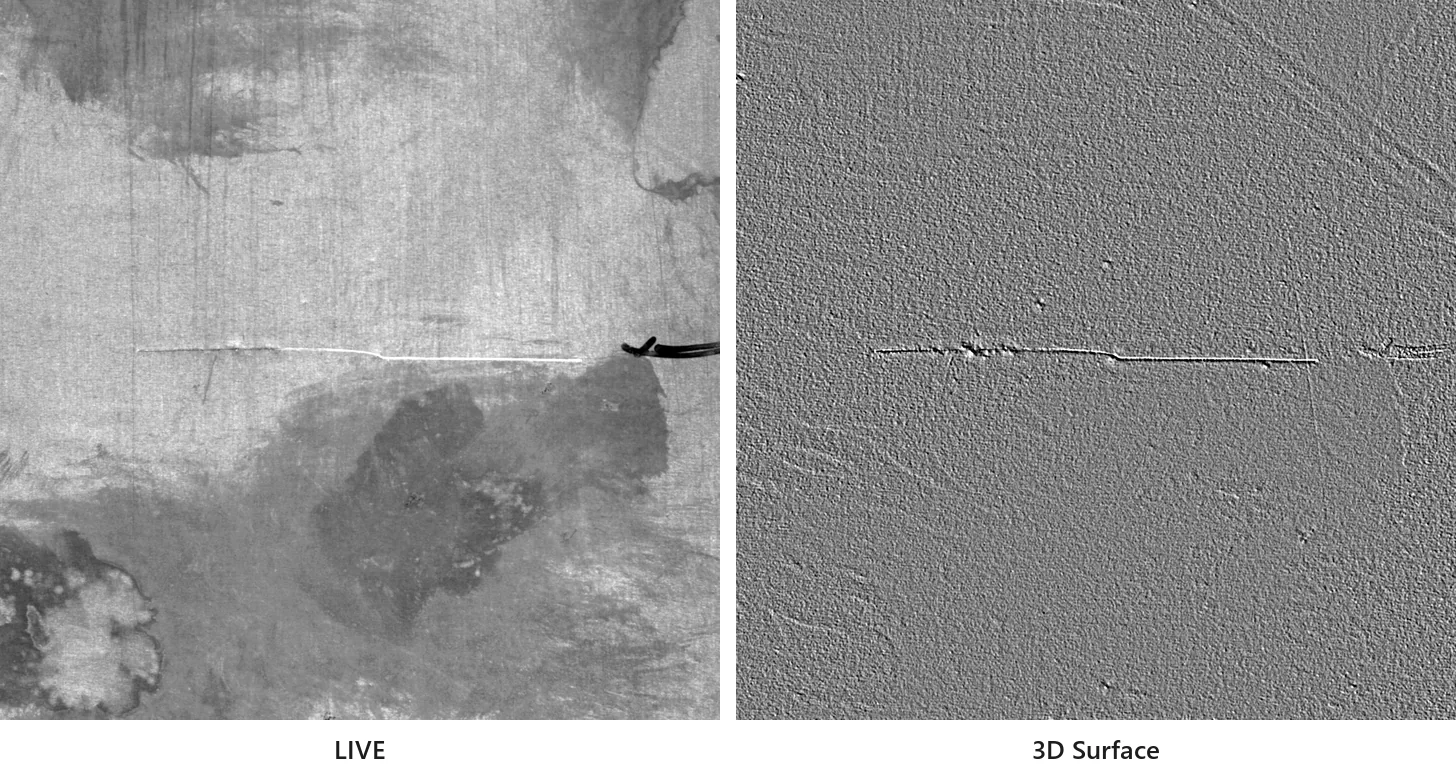
Defect ② appears to be where the dark surface film was scraped away, exposing the base metal. In LIVE it shines bright white (amplitude 66.3%), more clearly than in 3D Surface (28.1%). Yet the share of its length that can be followed as an unbroken line was reversed: 74% in 3D Surface versus 65% in LIVE.
The vertical defect ③ also lies on a clean area of the plate, so it can be traced in LIVE, and its SNR was higher in LIVE. The fine granular relief of the steel itself acts as noise on the 3D Surface side.
In other words, neither image is enough on its own. The TR-300 delivers LIVE and 3D Surface from a single capture, aligned pixel for pixel. Defects that show up as color and defects that exist only as shape are both captured in the same shot.
Measurements for the five defects and the stains
| Target | Metric | LIVE | 3D Surface |
|---|---|---|---|
| ① Diagonal line defect (two lines) | Amplitude / SNR | 1.7% / 2.2 | 21.3% / 6.8 |
| ② Horizontal line defect (base metal exposed) | Amplitude / SNR | 66.3% / 14.0 | 28.1% / 11.5 |
| ③ Vertical line defect | Amplitude / SNR | 8.5% / 8.3 | 27.1% / 5.9 |
| ④ Dent (small) | SNR | 2.6 | 6.7 |
| ⑤ Dent (large) | SNR | 2.9 | 7.0 |
| Dark stains vs. clean areas | Brightness difference (lower = stains less visible) | 66.4% | 0.2% |
Bold marks the better side for each metric.
- Amplitude: the size of the defect signal, as a percentage of background brightness.
- SNR: how many times larger the defect signal is than the surrounding background variation. Higher means more clearly separated from the background.
Imaging conditions
- System: TR-300 (line-scan configuration with FORESIGHT STEREO, four-direction lighting)
- Target: one steel plate (sample provided by a customer)
- Defects evaluated: three line defects and two dents marked in advance by the customer
- Images shown: Because the raw LIVE data is dark, one identical brightness adjustment was applied to every LIVE figure (it was not tuned per figure). 3D Surface images are unprocessed.
- Dimensions: No dimensional calibration was performed for this capture, so actual defect sizes are not stated.
Struggling with stained or discolored sheet material?
If defects hidden in color variation are being missed — or color variation is being flagged as defects — talk to us about imaging your own samples.
