
E3 ENGINE / Anomaly detection engine
It knows only
good products.
That is why it notices.
E3 ENGINE is an anomaly detection engine that learns from images of good products only. Without collecting samples of defects, it finds what falls outside the set of good ones, and returns — alongside the score — where the difference was, as an area.
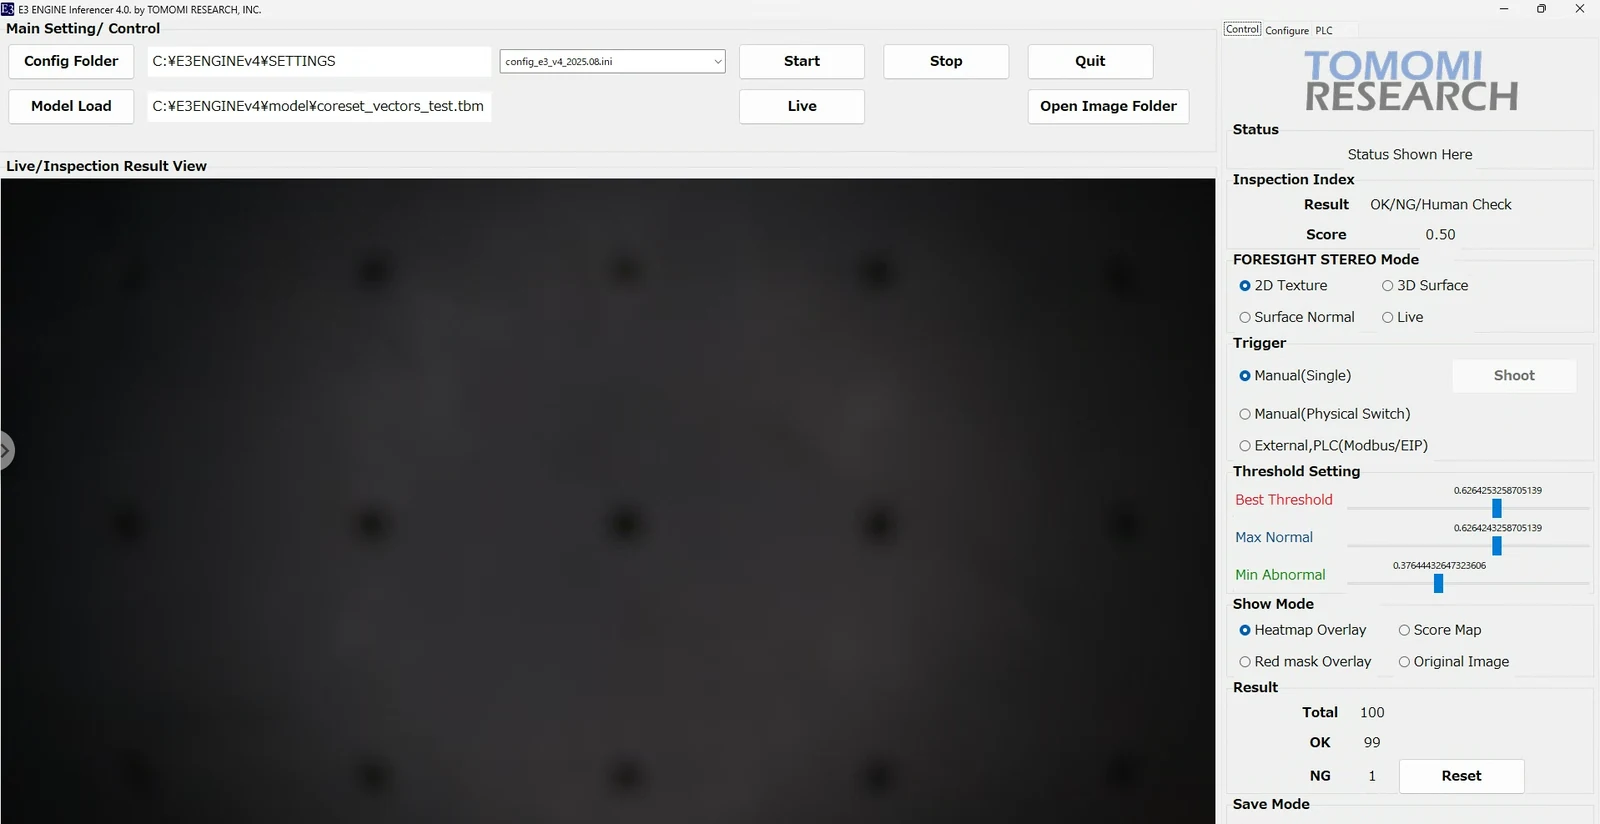
The E3 ENGINE Inferencer 4.0 screen. The counters on the right are values from a functional check and do not indicate performance.
What it returns
A number alone
does not move a factory.
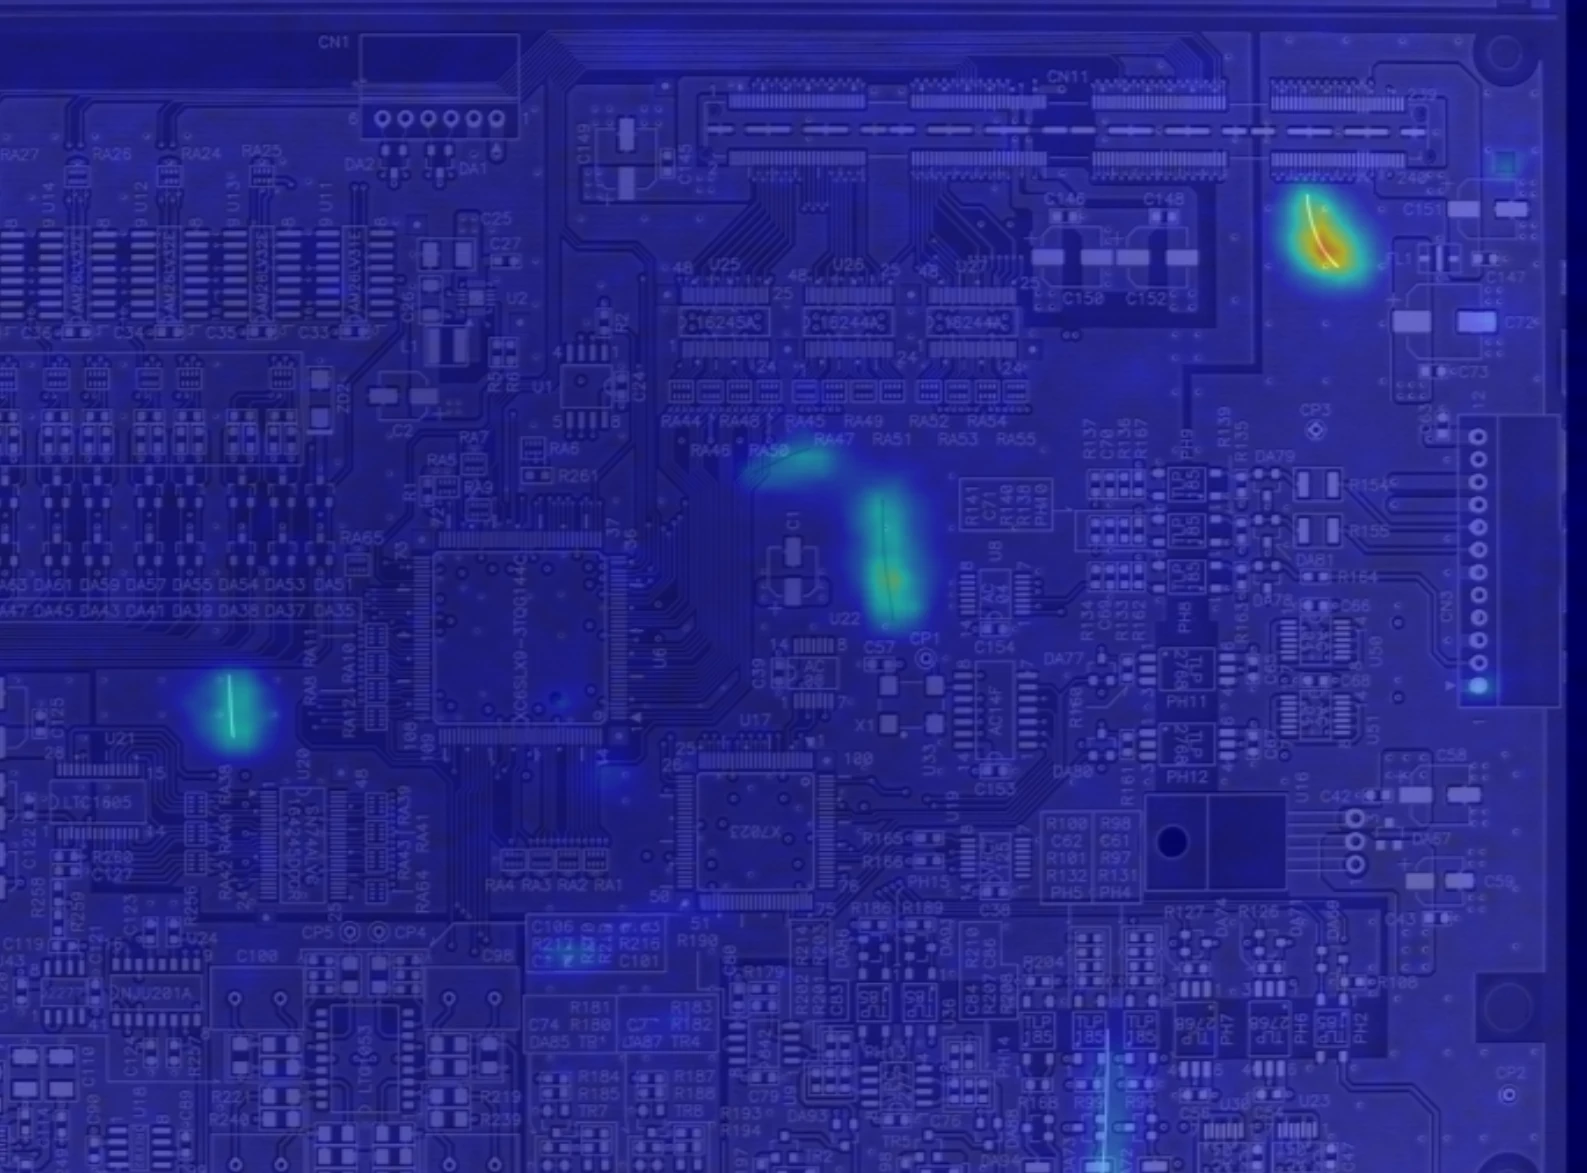
E3 ENGINE does not return only an anomaly score. It marks the regions that lie far from the model of good products, laid over the captured image, so that a person can see and check the reason for the verdict.
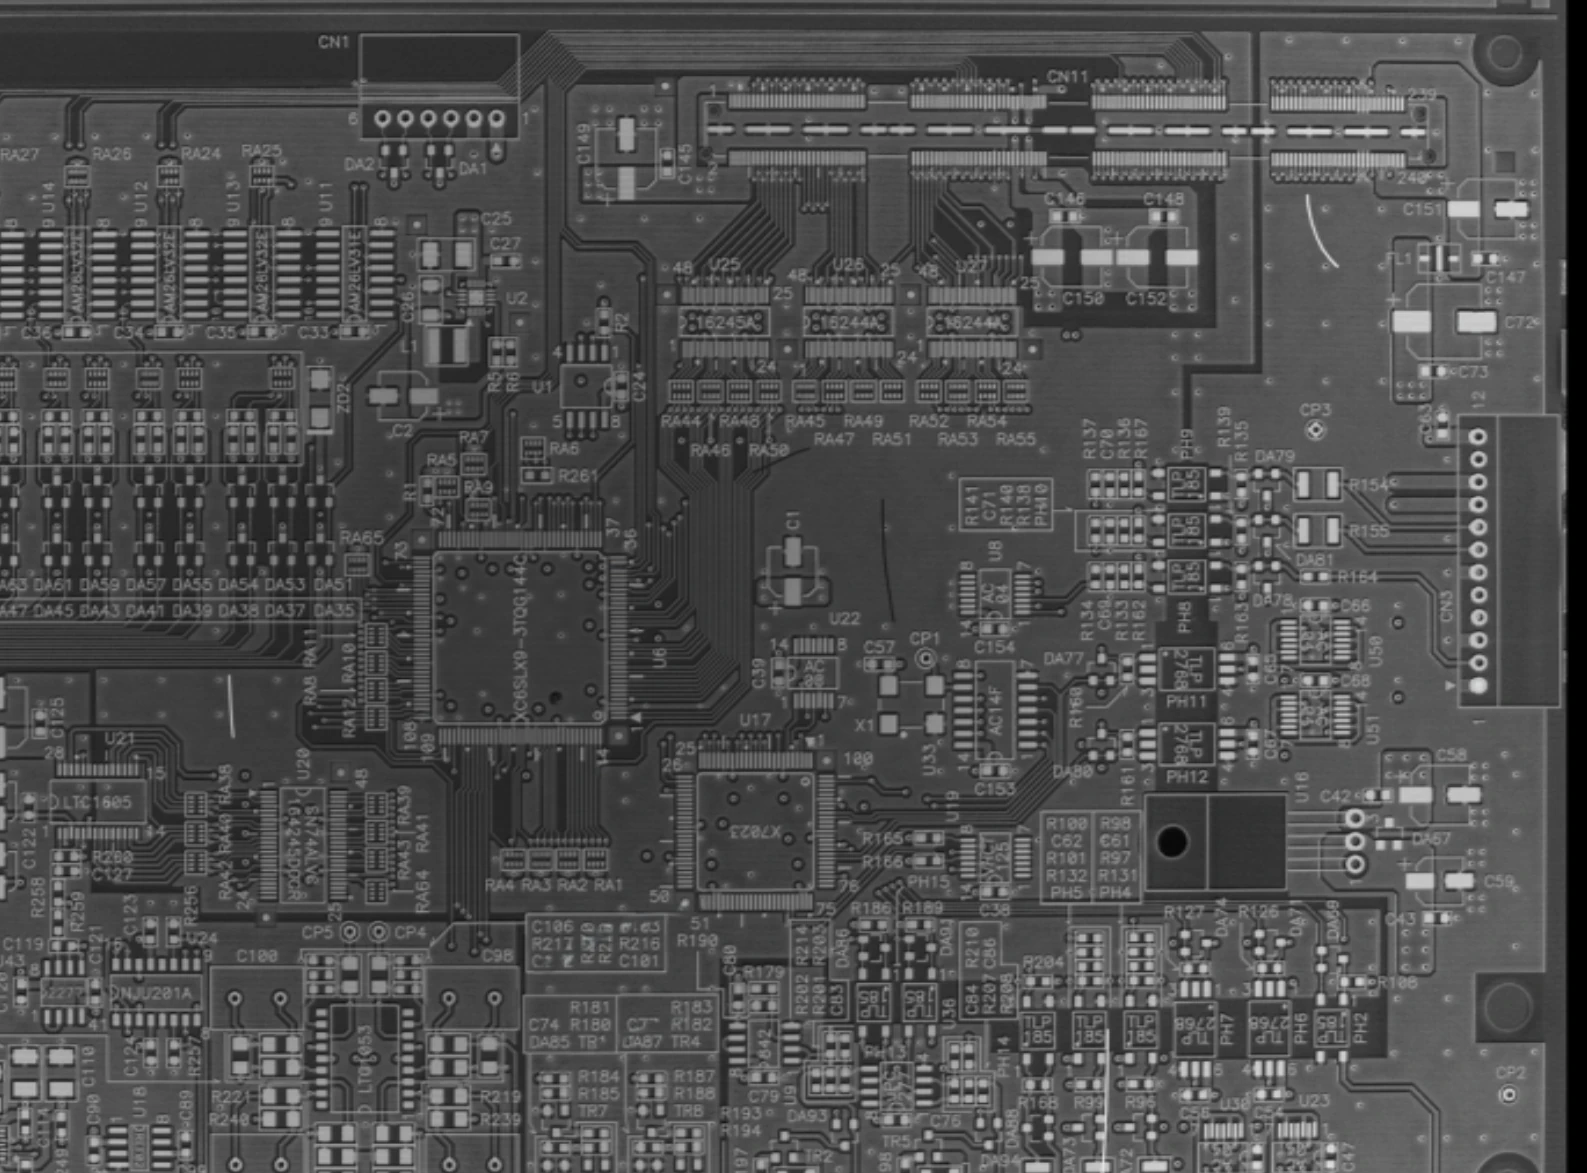
There are four displays: Heatmap Overlay / Score Map / Red mask Overlay / Original Image. On the floor the overlay gives the position; in verification the score map shows the distribution.
◀ Drag to compare ▶
A printed circuit board from a real project. Anomaly score 0.45 (threshold 0.169), verdict NG. The fine scratches lost in the pattern are shown, with their positions. The density of components and wiring itself does not provoke a response.
The problem
Teaching a machine the defects
runs out of road.
Training on collected defects does not hold up — the more stable the process, the less it holds. E3 ENGINE learns from good products only not for the sake of accuracy, but so that it can be kept running on a real floor.
Defects do not accumulate
In a process where good pieces are the overwhelming majority, enough defect images for training never build up. And you cannot wait until they do.
The kinds of defect cannot be fixed in advance
When a defect nobody anticipated appears, a classifier taught on defects does not know it. What it does not know, it goes on not knowing.
The standard shifts from person to person
The “something not present in a good one” that an experienced inspector senses has never been written down. Change the person and the verdict changes.
The answer
Hold what is normal for a good product,
as a set of features.
E3 ENGINE is built on PatchCore. Images of good products are divided into small patches, features are extracted, and only representative points far from one another are kept to form the set of good products (by default 10% of the whole).
At inference, it measures how far each patch of the input lies from that set. The further away, the higher the score, and the distribution of those distances is the anomaly map itself. It does not estimate how good-looking something is; it measures the distance from good.
The search is exhaustive (exact). An approximate index would be faster, but leaves the possibility of a miss. Here we choose an answer that does not change over speed.
Point it at a folder of good products
It reads good images only, extracts features and selects representative points. No labelling of defects. The model is saved as a .tbm file.
Set the thresholds
Evaluation data containing both good and defective pieces is scored, and three thresholds are set from the ROC, PR, F1, confusion matrix and score distribution. This step alone needs real examples of defects.
Decide on the floor
Capture → score → three-way verdict → anomaly map. Results are kept as images (PNG) and CSV.
Three verdicts
The band a machine cannot settle
goes back to a person.
The verdict is not a choice between OK and NG. The range where no call can be made is separated out as Human_Check and returned to human eyes. Not pretending to have settled what is unsettled is, we think, the condition for the result being trusted.
Within the range of good products
The anomaly score is at or below max normal. The distance from the set of good products falls inside the range good pieces showed at evaluation.
Neither can be said
Between max normal and min abnormal. Neither good nor defective can be asserted. A person looks at this band.
Outside the distribution of good products
The anomaly score is at or above min abnormal, inside the range defective pieces showed at evaluation.
The three thresholds are forced at entry to keep the order max normal ≤ optimal threshold ≤ min abnormal. A setting that breaks the order is not accepted.
How it actually separated.
Measured on the same project as the comparison above (visual inspection of a printed circuit board). Trained on 122 good pieces only, and evaluated on 13 good and 5 defective.
| Object | Printed circuit board (real project) / input was the 2D Texture output of FORESIGHT STEREO® |
|---|---|
| Training | 122 good pieces only (no labelling of defects) |
| Evaluation | 13 good / 5 defective |
| Scores, good | 0.10 – 0.14 (13 pieces) |
| Scores, defective | 0.17 / 0.22 / 0.29 / 0.38 / 0.45 (5 pieces) |
| Optimal threshold | 0.169 (between the top of the good pieces and the bottom of the defective) |
| ROC-AUC | 1.000 (on this evaluation set) |
| Conditions | Image size 1024 / crop 16 / patch 3 / representative points 10% / trained 2026-02-12 |
※ The evaluation is a small sample of 18 images. A ROC-AUC of 1.000 is the value for this object, these imaging conditions and this evaluation set, and does not generalise to other objects. Whether the scores of good and defective pieces separate has to be confirmed object by object; where the separation is shallow, the Human_Check band is set wider.
With more images, it looks like this.
The project above was a small sample of 18. To see the separation itself on a large sample, here is an evaluation on a public dataset of images of cracks in concrete: 4,000 good and 20,000 defective, 24,000 in all.
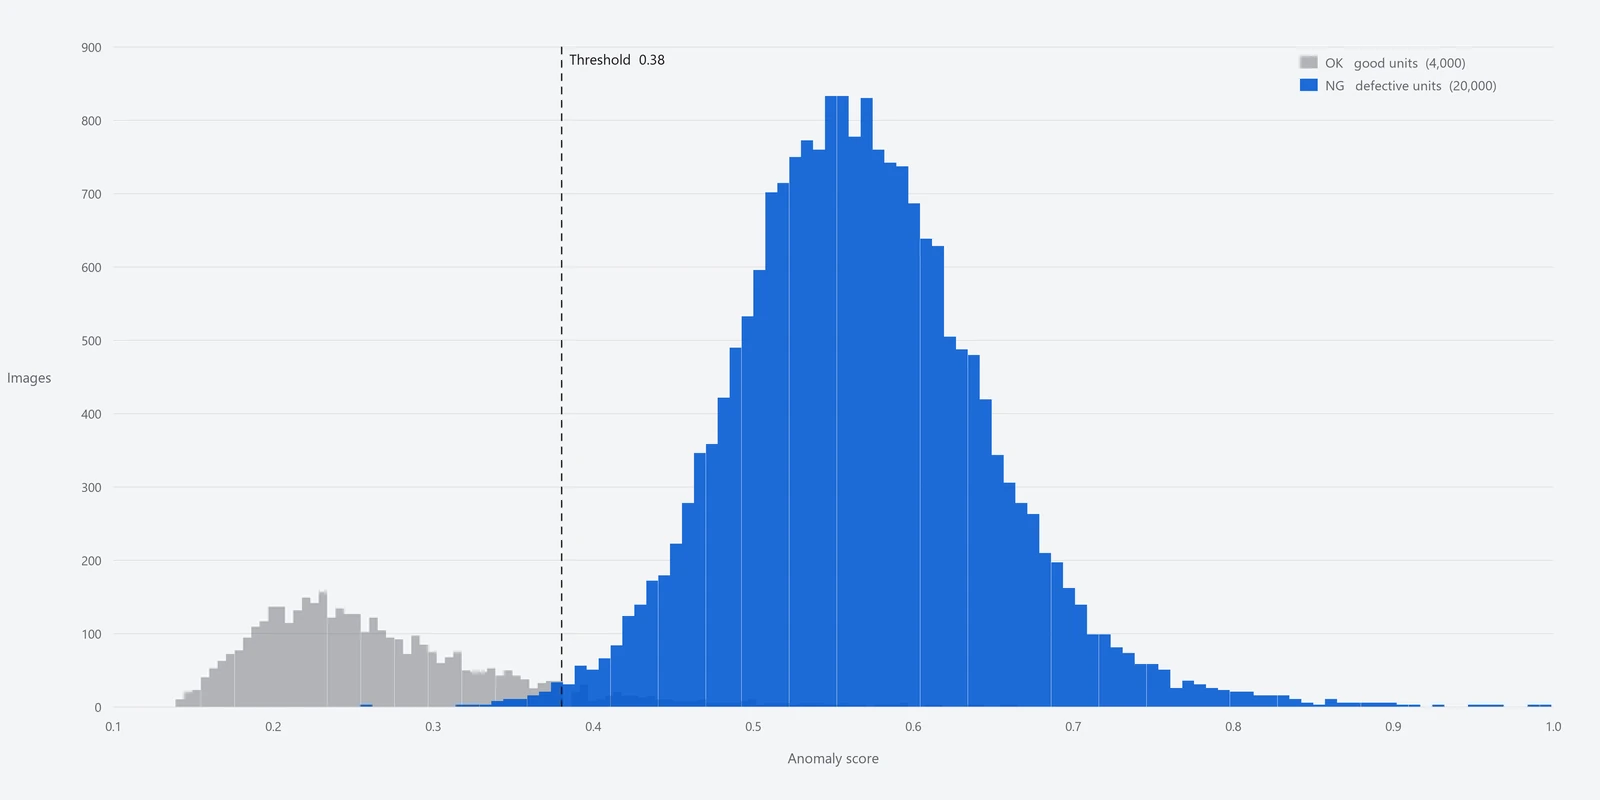
Good and defective form separate hills. The dashed line is the optimal threshold, 0.38. The further apart the hills, the steadier the verdict; the overlap is what corresponds to Human_Check. This is the evaluation graph produced by E3 ENGINE Trainer, redrawn in the colours of this site without changing the height of a single bar. The original graph and the bin data to reproduce it are kept in output/assets/07_e3engine/.
※ This is an evaluation on a publicly available dataset, not a record from a customer project. The subject is cracking in concrete, a different kind of object from the metal surfaces we usually inspect. What is worth reading here is not the accuracy figure but the shape of the distribution — that good and defective fall into separate hills. Whether the same shape appears has to be confirmed object by object.
What it looks at
Change what is looked at,
and what can be noticed changes.
E3 ENGINE can take any of the four outputs that FORESIGHT STEREO® produces from a single capture. A condition that never appears in the ordinary capture (Live), because the reflection swallows it, remains as a difference once it is taken as surface direction. Before changing the algorithm, change what is being looked at.
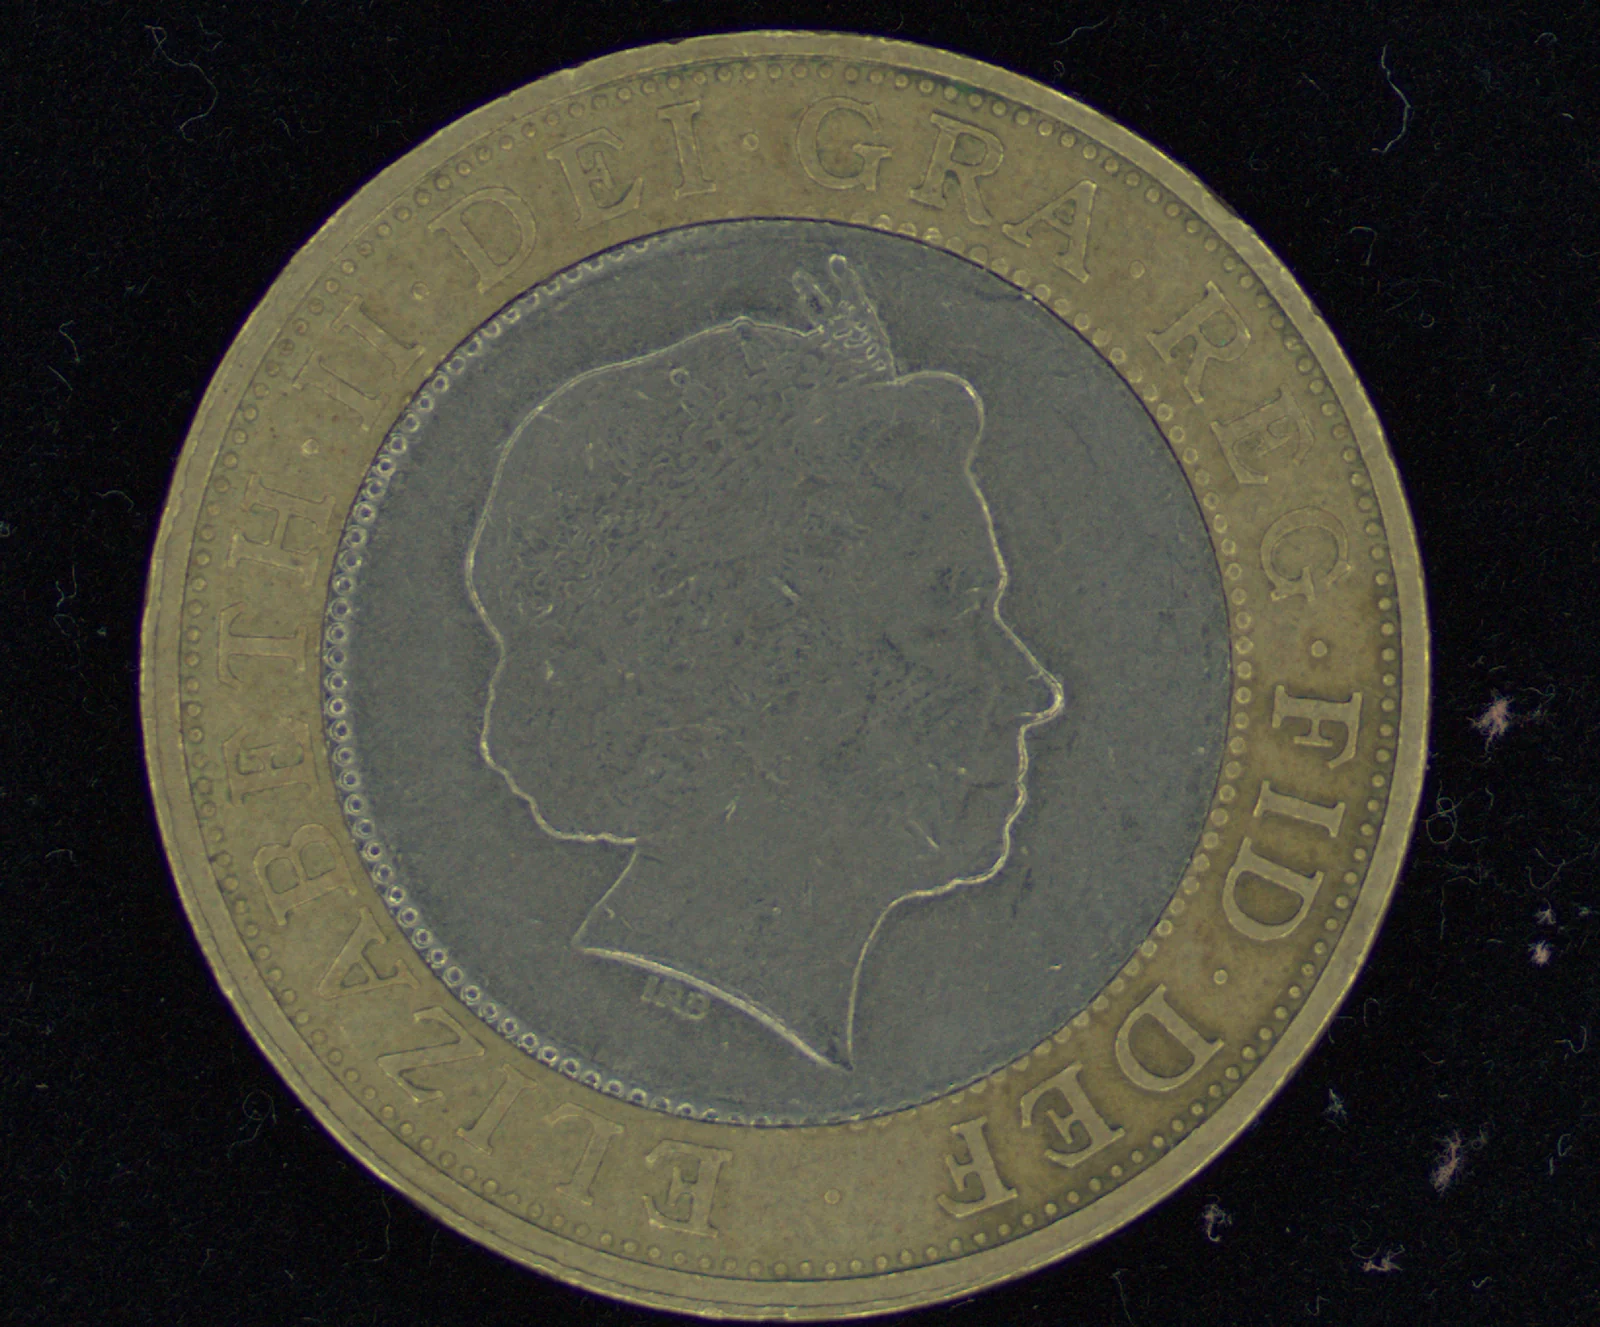
The image as the eye sees it.
The ordinary capture, kept as the reference. Reflections and shadows remain.
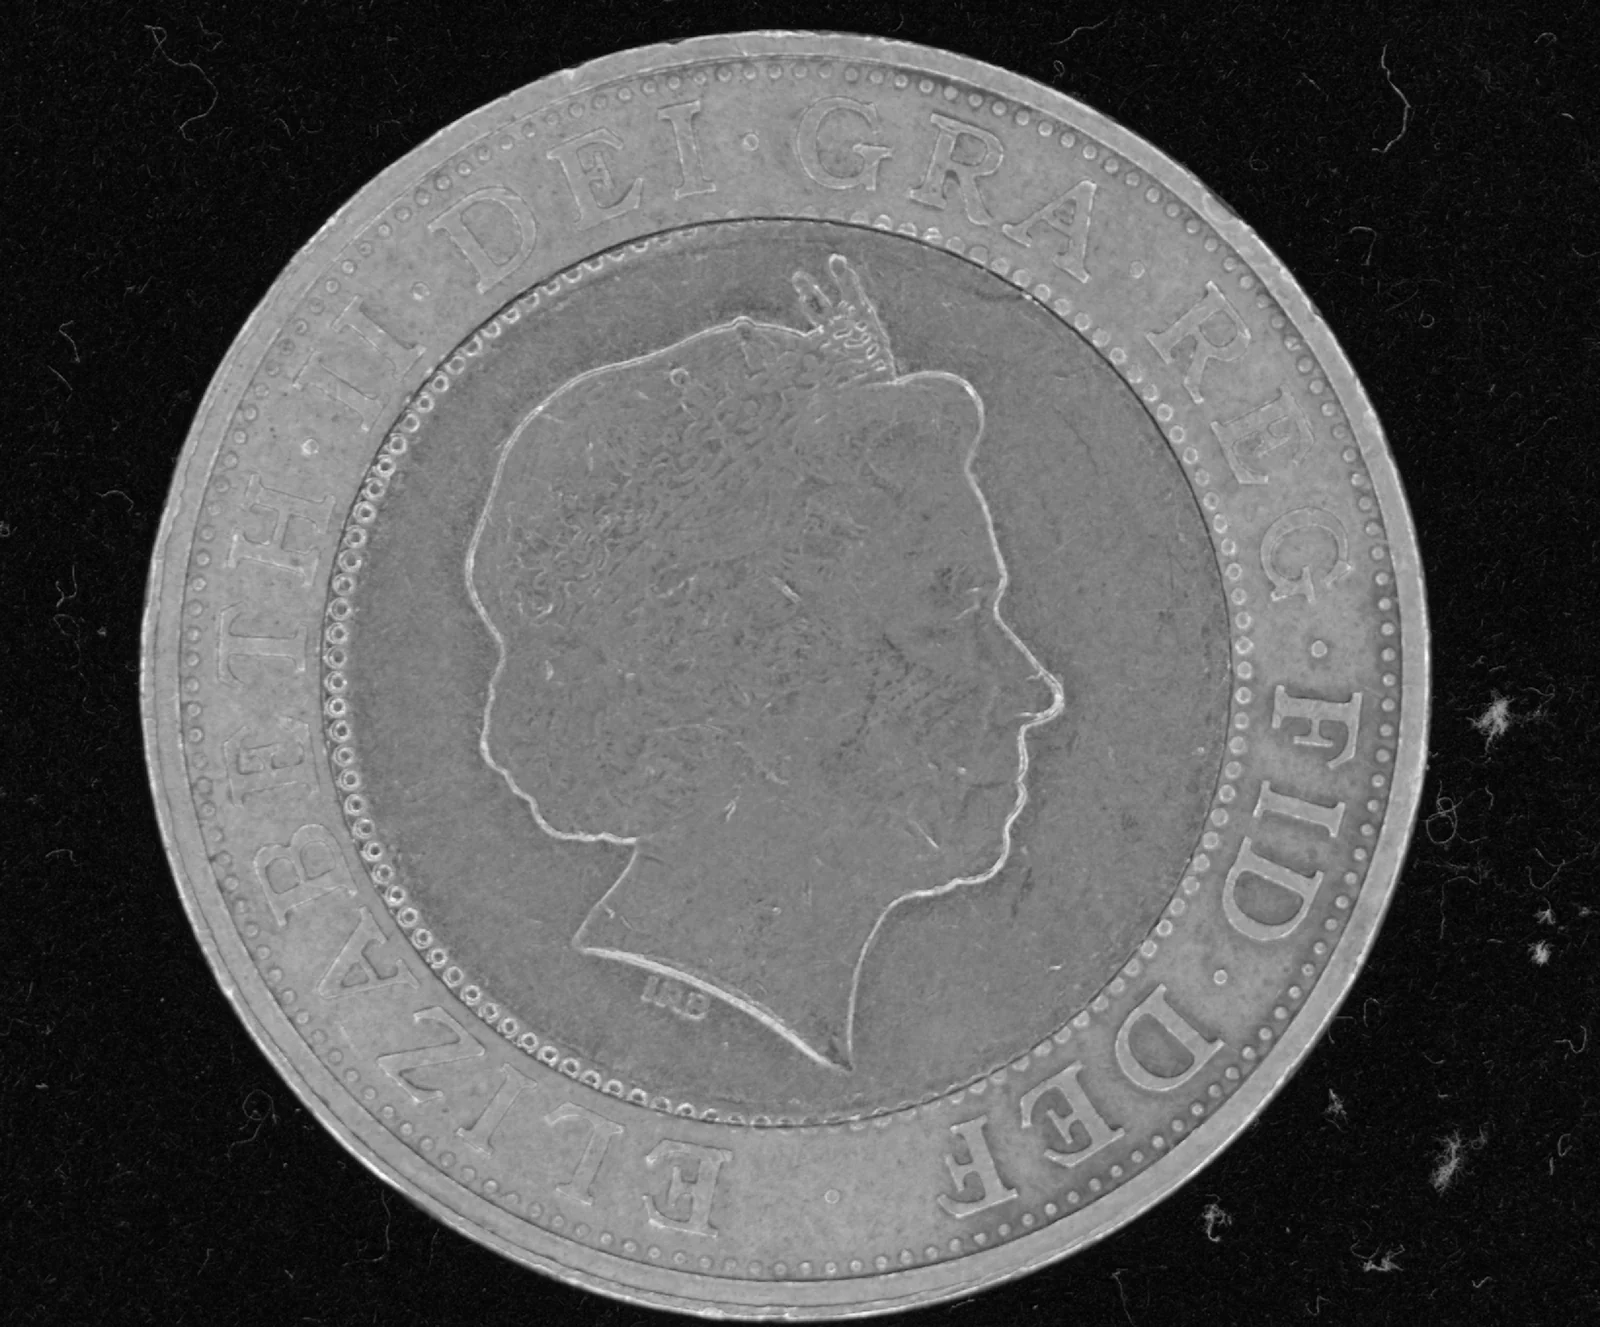
Shading discarded, material kept.
Suited to differences that show as reflectance: soiling, discolouration, printed marks.

Material discarded, shape kept.
Suited to differences that show as relief: dents, chips, deformation.
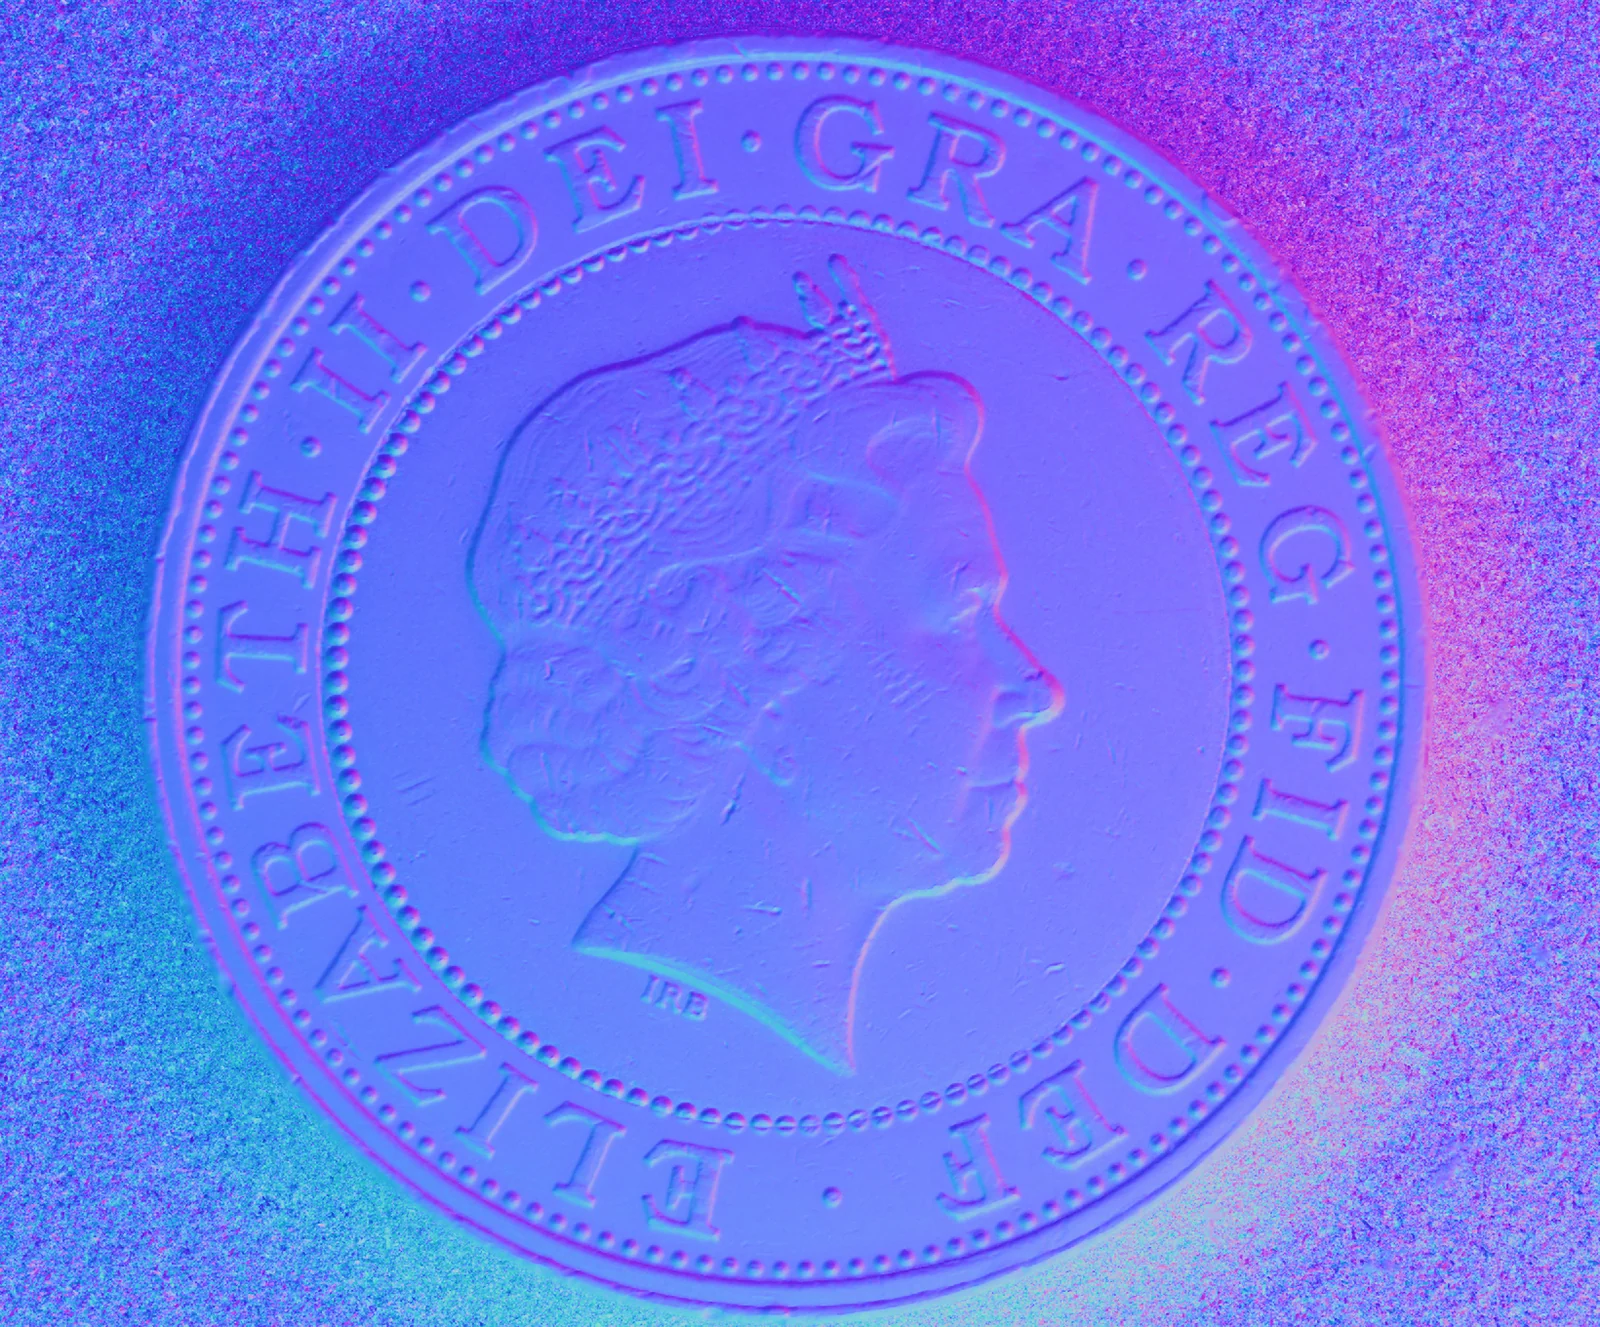
Surface direction, encoded as colour.
A feature independent of the lighting. How it appears changes little when the light does.
Which output to use as the input depends on the object. Which one works is settled by verification on samples 〔要確認:対象物別の推奨入力の整理〕.
On the line
It moves on the floor's signal.
Inspection does not stand on its own. E3 ENGINE can be started by a person, by a signal from a machine, or by an instruction from a robot or PLC. The verdict returns along the same path.
Three ways to start it
A button on screen (manual) / a physical switch / an external PLC (Modbus, EIP). You can commission by hand and move to an external trigger for production.
Working with a robot
Supports a configuration in which upper-level equipment requests the capture and E3 ENGINE returns the verdict. The verdict passes as 0 = NG / 1 = OK / 2 = Human_Check, still three-way. 〔要確認:対応するロボット/PLC の機種範囲〕
Driving the camera and the lights too
A configuration that includes control of Basler Pylon cameras (USB3 / GigE) and multi-direction lighting. For GigE there is a fast build with acquisition and display separated; live display runs at about 30 fps 〔要確認:測定条件〕.
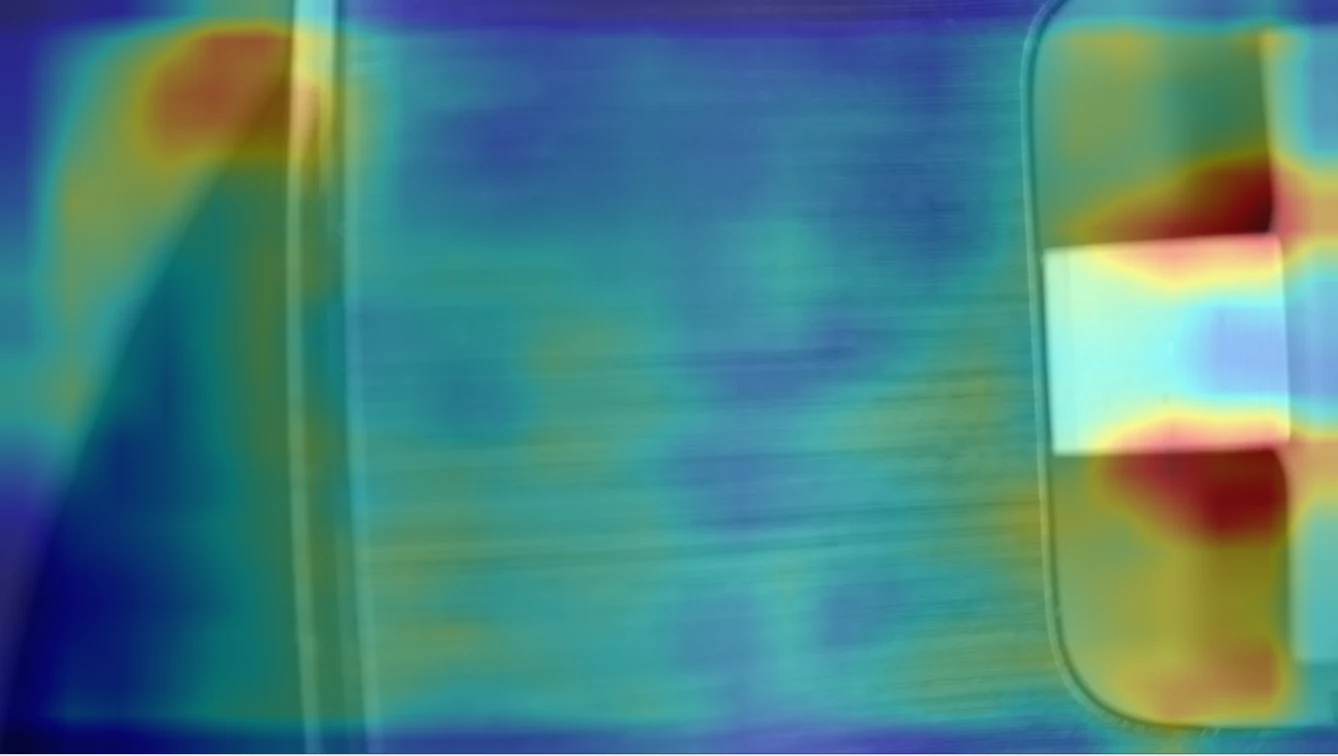
Display from a configuration working with a robot. From the request to capture through to the return of the verdict, the machine's signal drives it.
Three applications
Training, inference and trial,
held apart.
E3 ENGINE is supplied as three applications, because the person who trains, the person who runs it on the floor and the person trying it before adoption need different things.
Training and evaluation
Point it at a folder of good products to build a model (.tbm), then produce the ROC and PR curves, F1 against threshold, the confusion matrix and the distribution of anomaly scores, and compute the optimal threshold. Training settings can be changed on screen and saved to a configuration file.
Inference on the floor
Loads a trained model and carries capture → inference → verdict → display. It keeps the verdict image (PNG) and the inference result (CSV), so results can be looked at afterwards.
Trying it without a camera
Reads images from a folder and runs inference. No camera, no lighting. Used to judge before adoption, and to work out thresholds and pre-processing conditions.
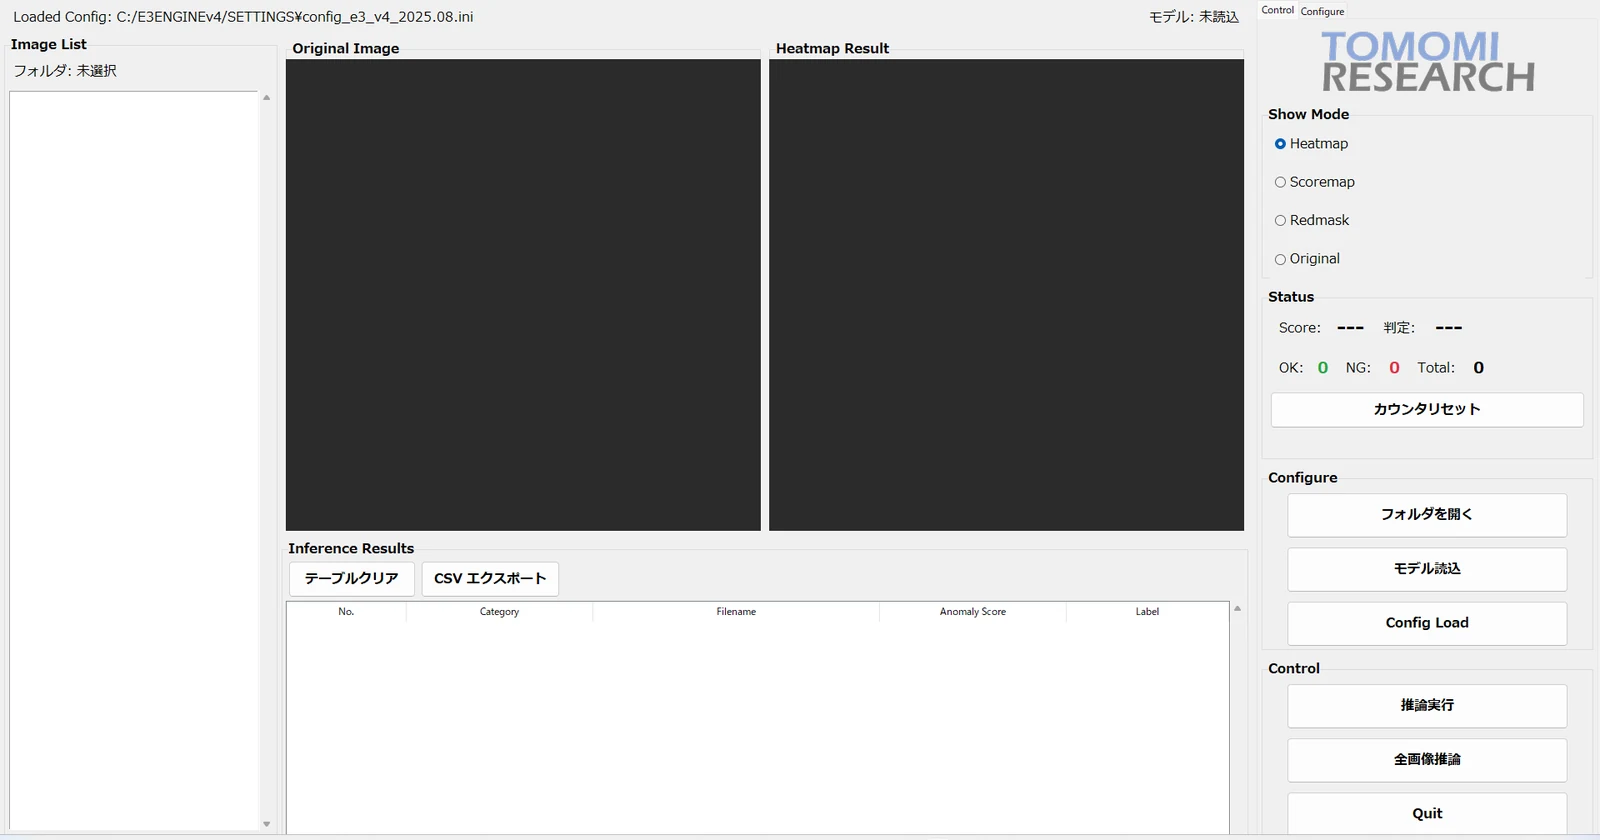
The Simulator screen, before any image or model has been loaded. The original and the result are checked side by side, and results can be written out as CSV.
Specifications
What has been settled.
What is fixed about the software, and our own measurements together with their conditions. Items that vary by configuration or by project are marked 〔要確認〕.
| Category | Anomaly detection engine (decision software) |
|---|---|
| Learning | Unsupervised anomaly detection. Trained on images of good products only (an implementation built on PatchCore) |
| Search | Exhaustive (exact) nearest-neighbour search. No approximate index |
| Verdict | Three-way / OK/Human_Check/NG (the order max normal ≤ optimal threshold ≤ min abnormal is enforced) |
| Display modes | Heatmap Overlay / Score Map / Red mask Overlay / Original Image |
| Input | Chosen from the four outputs of FORESIGHT STEREO® (Live / 2D Texture / 3D Surface / Surface Normal) |
| Main parameters | Image size 256 / crop 16 / patch 3 / stride 1 / embedding dimension 1024 / projection dimension 128 / share of representative points 10% (all defaults; changeable on screen) |
| Capture trigger | Manual (on screen) / physical switch / external PLC (Modbus, EIP) |
| External interfaces | Connection to upper-level equipment (PLC, robot) over Modbus TCP〔要確認:対応機種の範囲〕 |
| Cameras | Basler Pylon (USB3 / GigE). Live display on the fast GigE build about 30 fps〔要確認:測定条件〕 |
| Lighting | Control of multi-direction lighting supported (Leimac 8ch / 4ch, CCS)〔要確認:公開する型式の範囲〕 |
| Output | Verdict image (PNG) / inference result (CSV) |
| Pre-processing | The Python pre-processing module can be replaced. A configuration that reloads the mask used at training and reproduces it at inference is also supported |
| Training visualisations | ROC and PR curves, F1 against threshold, confusion matrix, distribution of anomaly scores |
| Applications | Trainer (training and evaluation) / Inferencer (inference on the floor) / Simulator (trial without a camera) |
| Environment | Windows 10 / 11, a CUDA-capable GPU〔要確認:推奨構成/最小構成〕 |
| Licensing | Licence activation is required |
| Processing speed (our measurement) | About 29 ms per image at inference (of which feature extraction 28.2 ms and nearest-neighbour search 0.7 ms) Conditions: NVIDIA RTX 3090 / image size 256 / public dataset MVTec AD / measured 2026-07-17. More than 95% of the time is feature extraction (the CNN forward pass), so it changes considerably with image size and GPU. |
| Detection performance (our measurement) | ROC-AUC / public dataset MVTec AD (same conditions): bottle 1.000 / capsule 0.997 / screw 0.970 Real project (printed circuit board; trained on 122 good, evaluated on 13 good and 5 defective): 1.000 All are our own measurements, and the values change with the object, the imaging conditions and the evaluation set. They do not guarantee performance on your object. |
| Start-up | Index construction after loading the model, 1.0 – 1.5 ms (same conditions, our measurement) |
| Supply | Quoted individually according to configuration |
※ E3 ENGINE is an engine that puts a number on the distance from the distribution of good products, and does not classify the type of defect. Training can be done with images of good products alone, but calibrating the thresholds needs evaluation data containing both good and defective pieces. Whether something can be detected changes with the object and with the imaging and lighting conditions, so we ask for verification on samples before adoption. “Visible” here means physically based observation and visualisation, not generative estimation. Every figure on this page is our own measurement, given with its conditions. Change the conditions and the values change, so they do not guarantee performance on your object.
Where it sits
E3 ENGINE in the three layers.
Our products are built in three layers. E3 ENGINE sits in the decision layer, taking the physical quantity the sensor produced and returning a verdict.
FORESIGHT STEREO®
A 3D imaging technique developed from photometric stereo. From illumination in many directions it takes the surface normal, independently of the lighting, and recovers 3D shape. The layer that makes the input for E3 ENGINE.
E3 ENGINE®
The anomaly detection engine. It learns from good products only and puts a number on the “something not present in a good one” that an inspector senses. The verdict is three-way.
TR series
The systems that carry the sensor and the decision. The configuration is chosen to suit the conditions and the purpose. TR-300 is the 3D × AI inspection system for continuous inspection on a moving line; TR-55 is for observation.
Related
Related products
The core technology that hands E3 ENGINE its input. A 3D imaging technique that takes the surface normal, independently of the lighting, from illumination in many directions.
Read more →
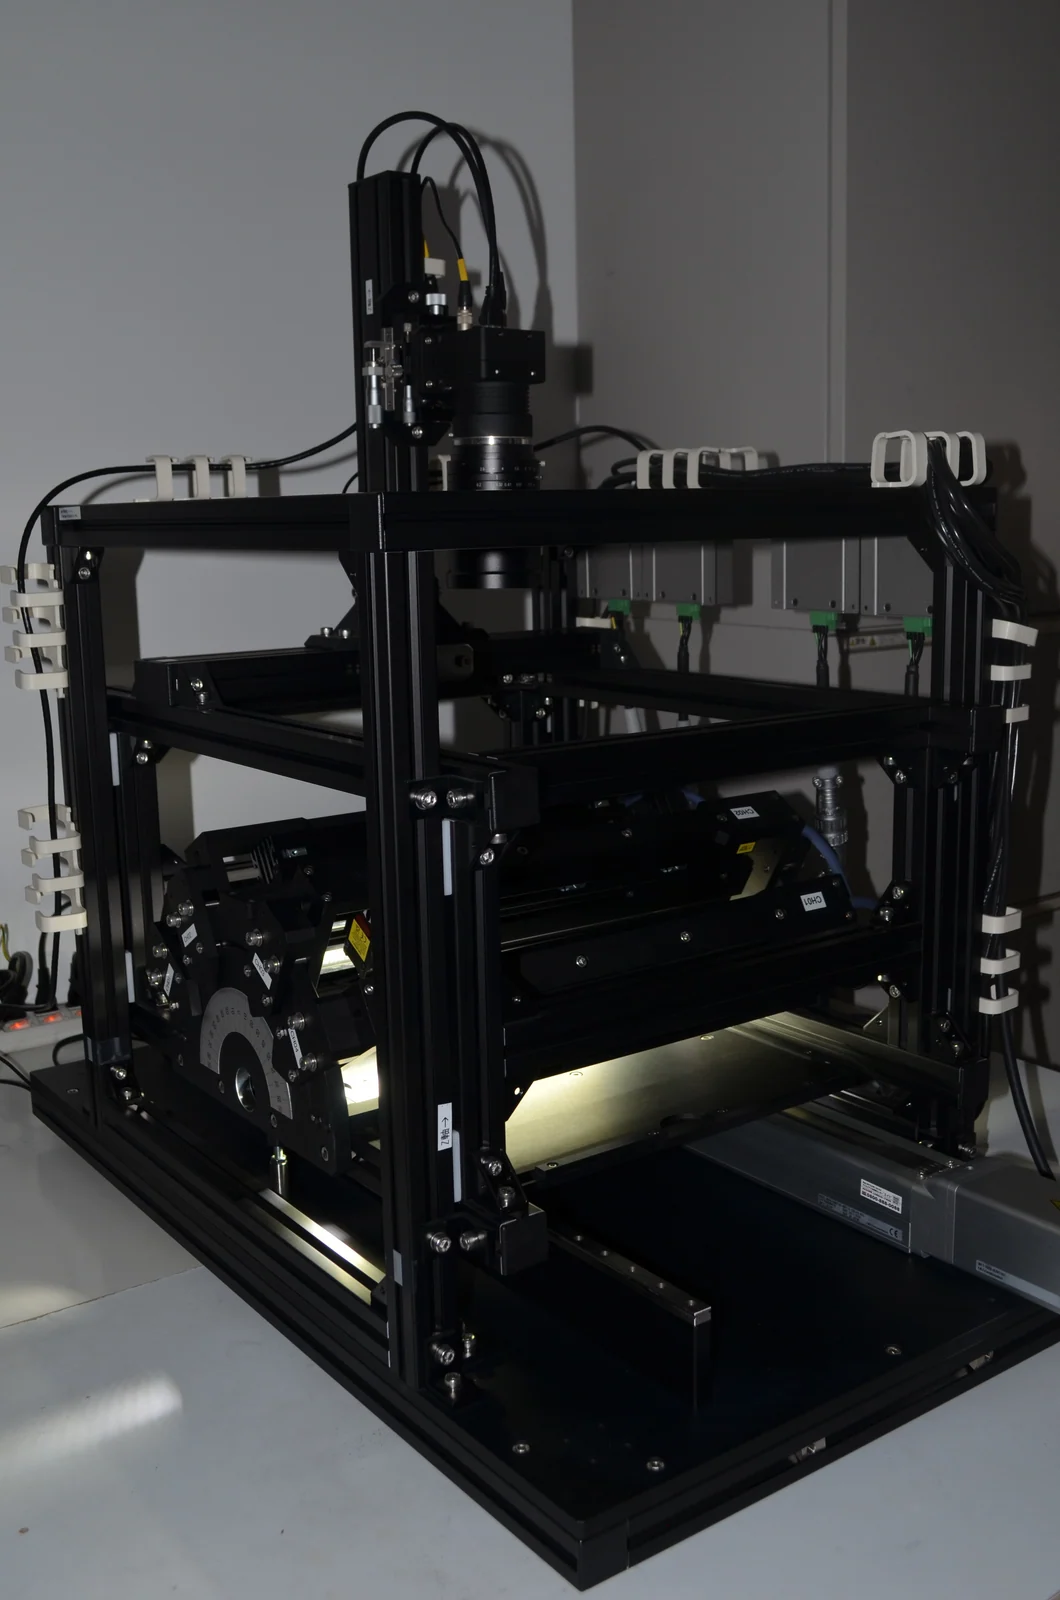
A continuous inspection system carrying the sensor and E3 ENGINE. Winner of the Kanagawa Industrial Technology Development Award, Future Creation Prize.
Read more →
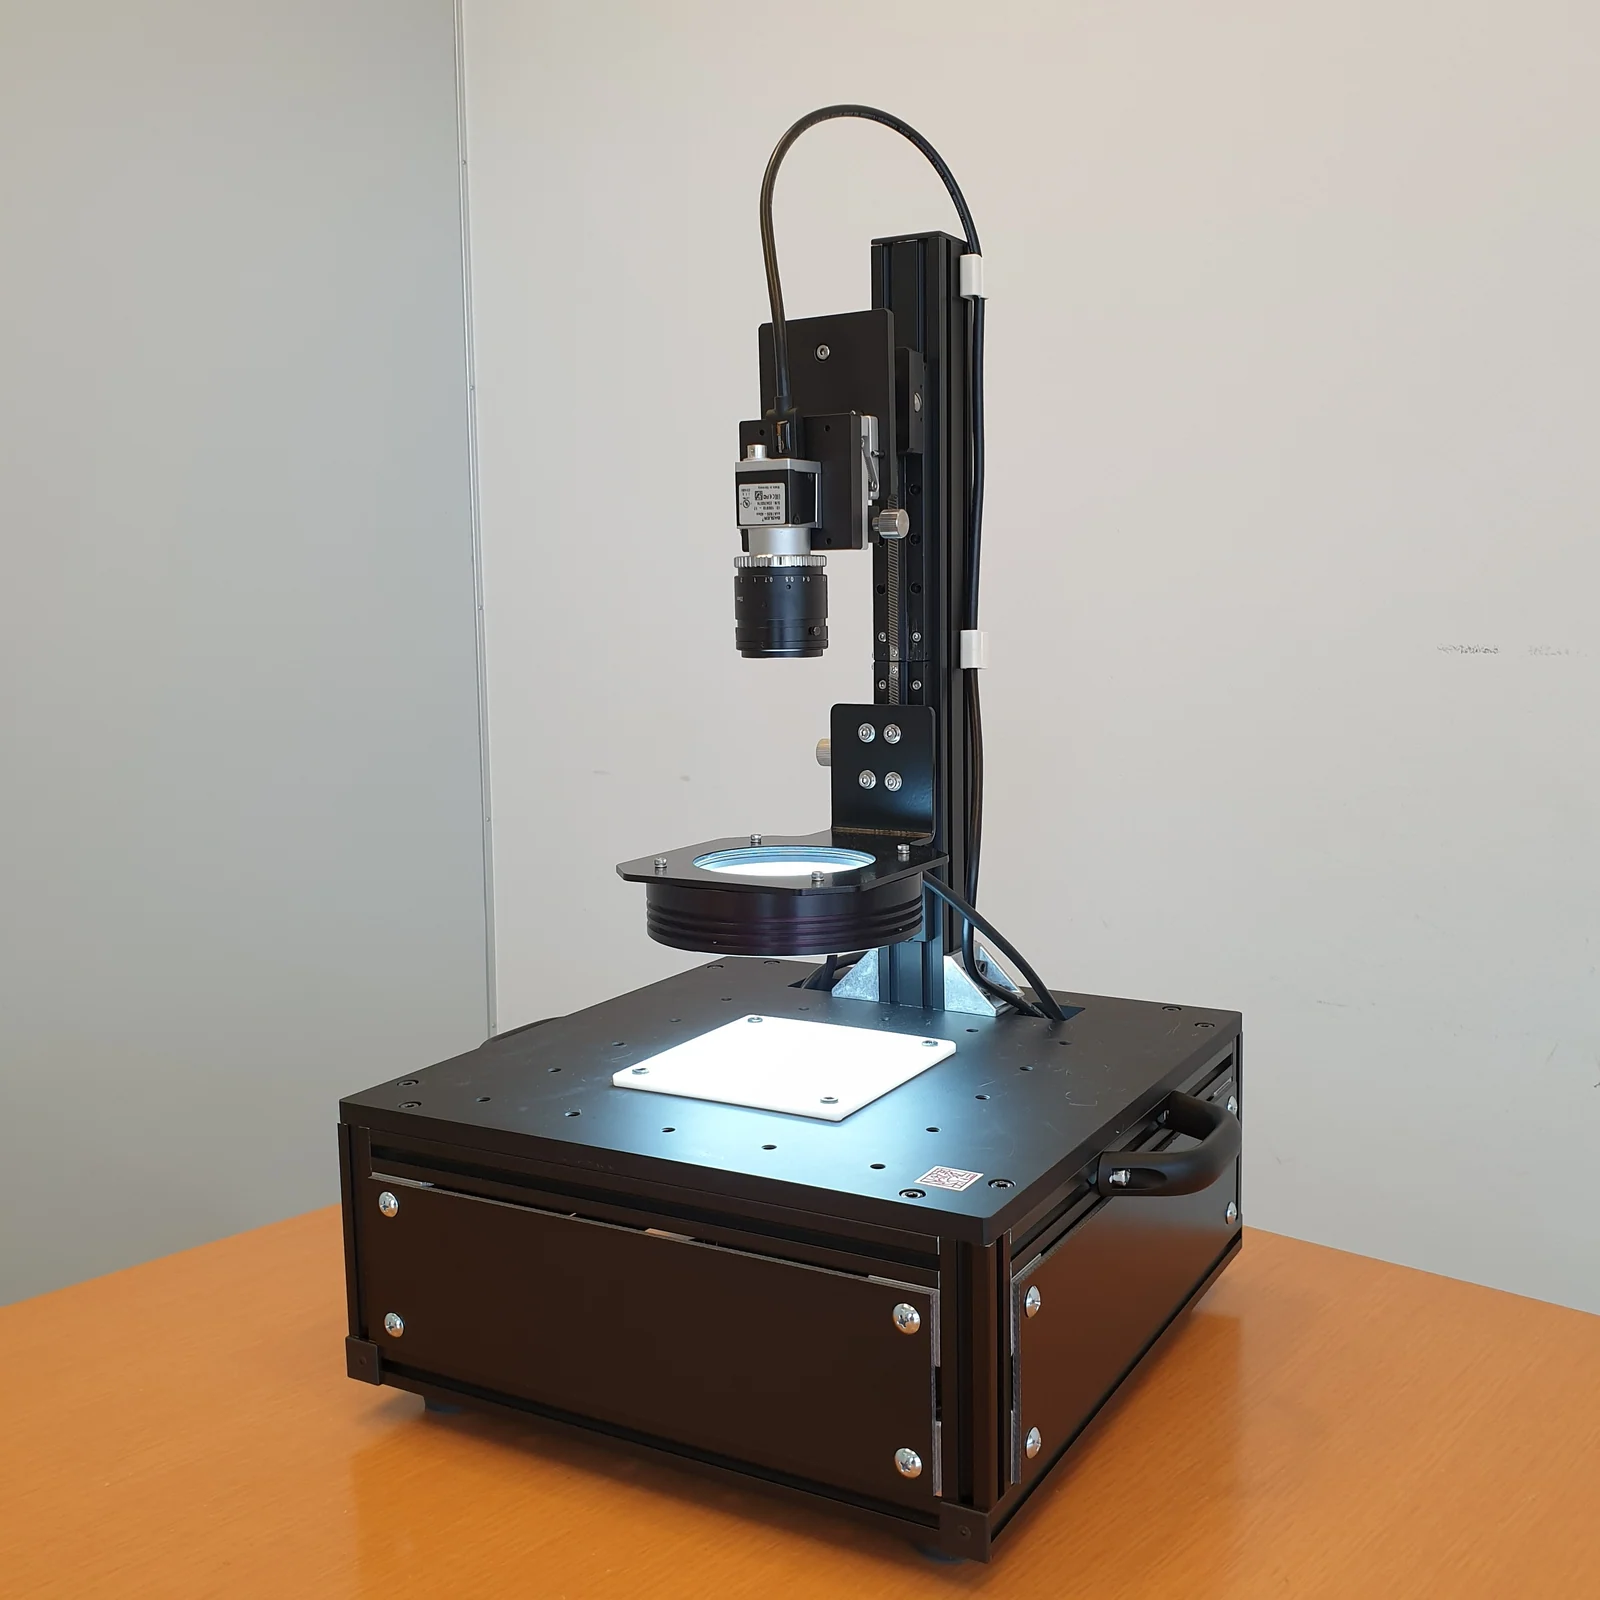
Place it, press it, and the four outputs come back. Built for observation, so it does not include E3 ENGINE.
Read more →
Contact
If what you need to see
is not yet visible.
Tell us the object, the kind of difference you need to catch and how good pieces vary, and we will work out together whether E3 ENGINE can separate it. Verification on your own samples can be arranged.