
Technology
What makes
seeing possible.
Our technology has two sides: the sensor and the decision. The sensor measures the direction a surface faces, assembles that into height, and captures one row at a time even on a line that never stops. The engine counts the distance from good products and notices the difference. This page describes those methods themselves, separately from any product name.
It exists to answer, in advance, the questions we are always asked across a table.
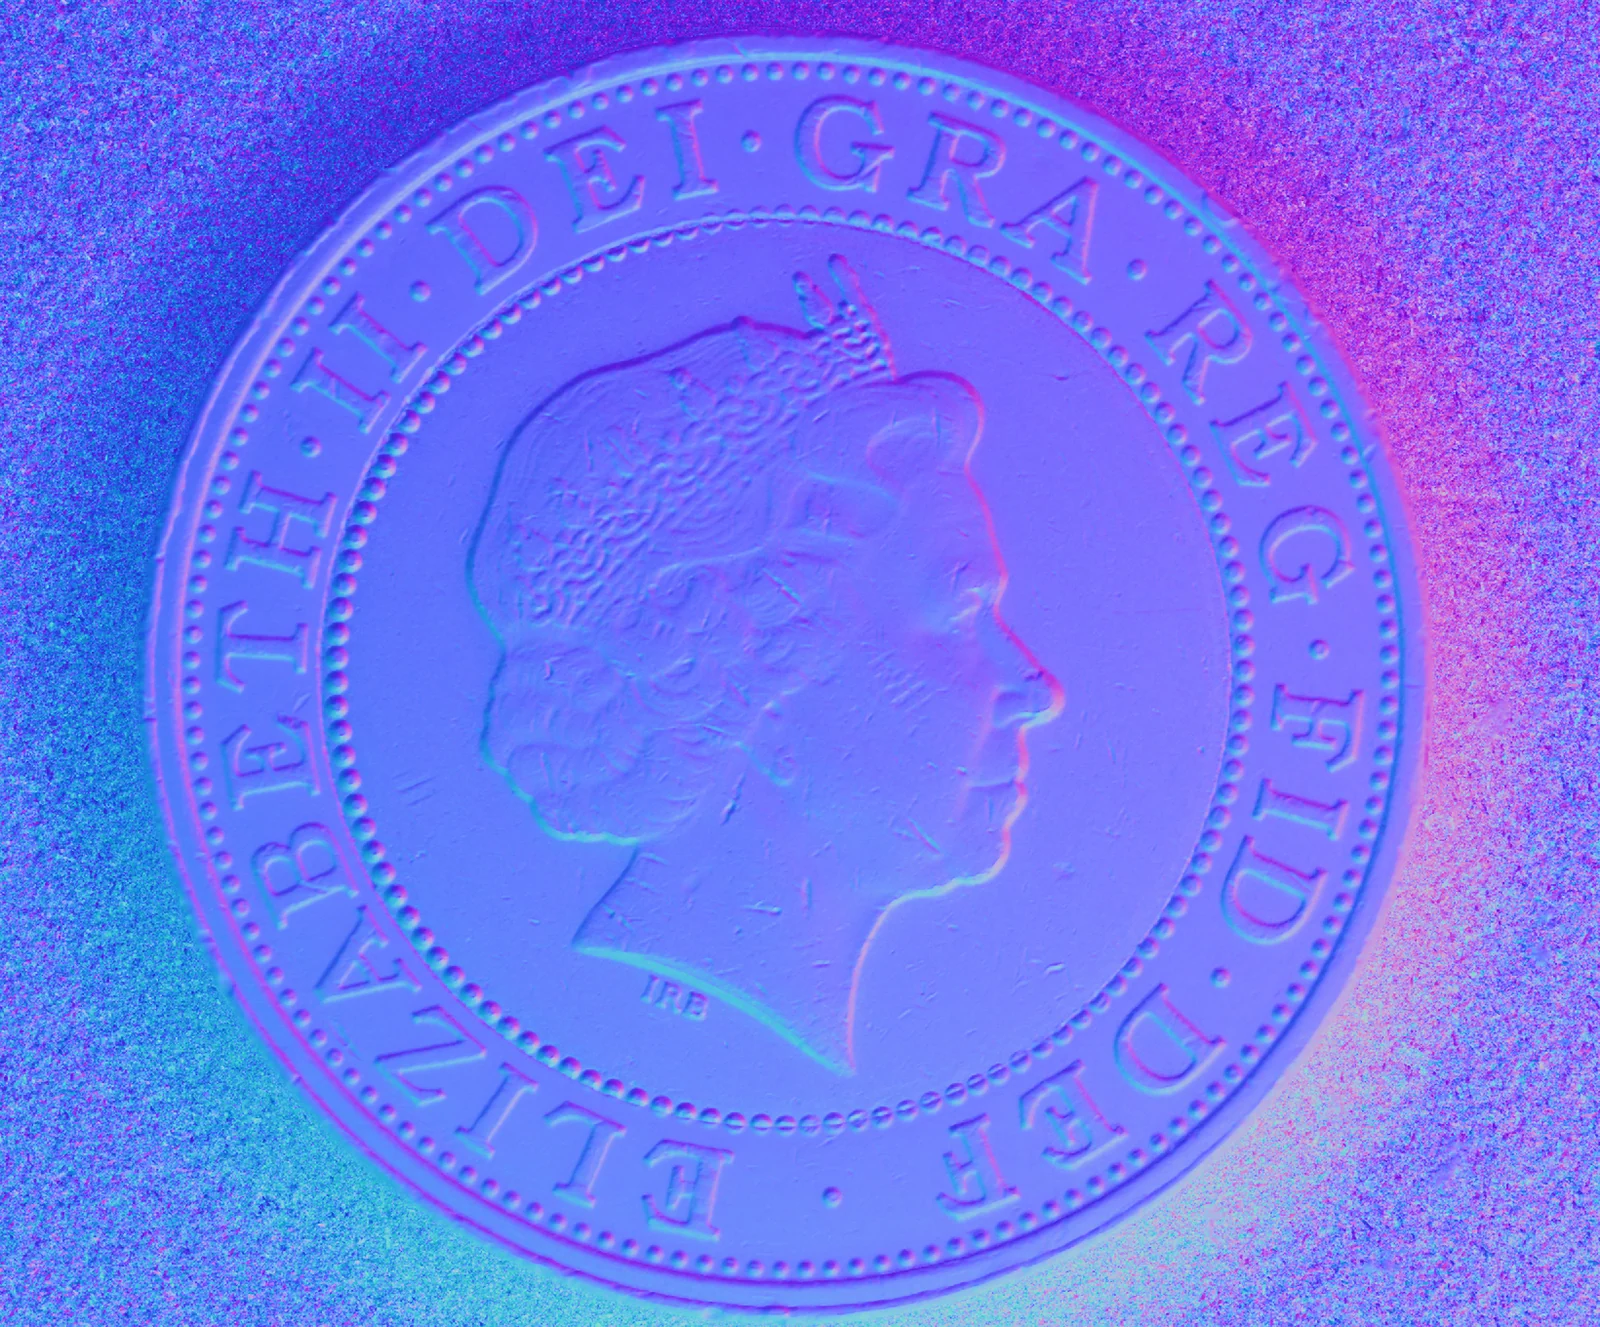
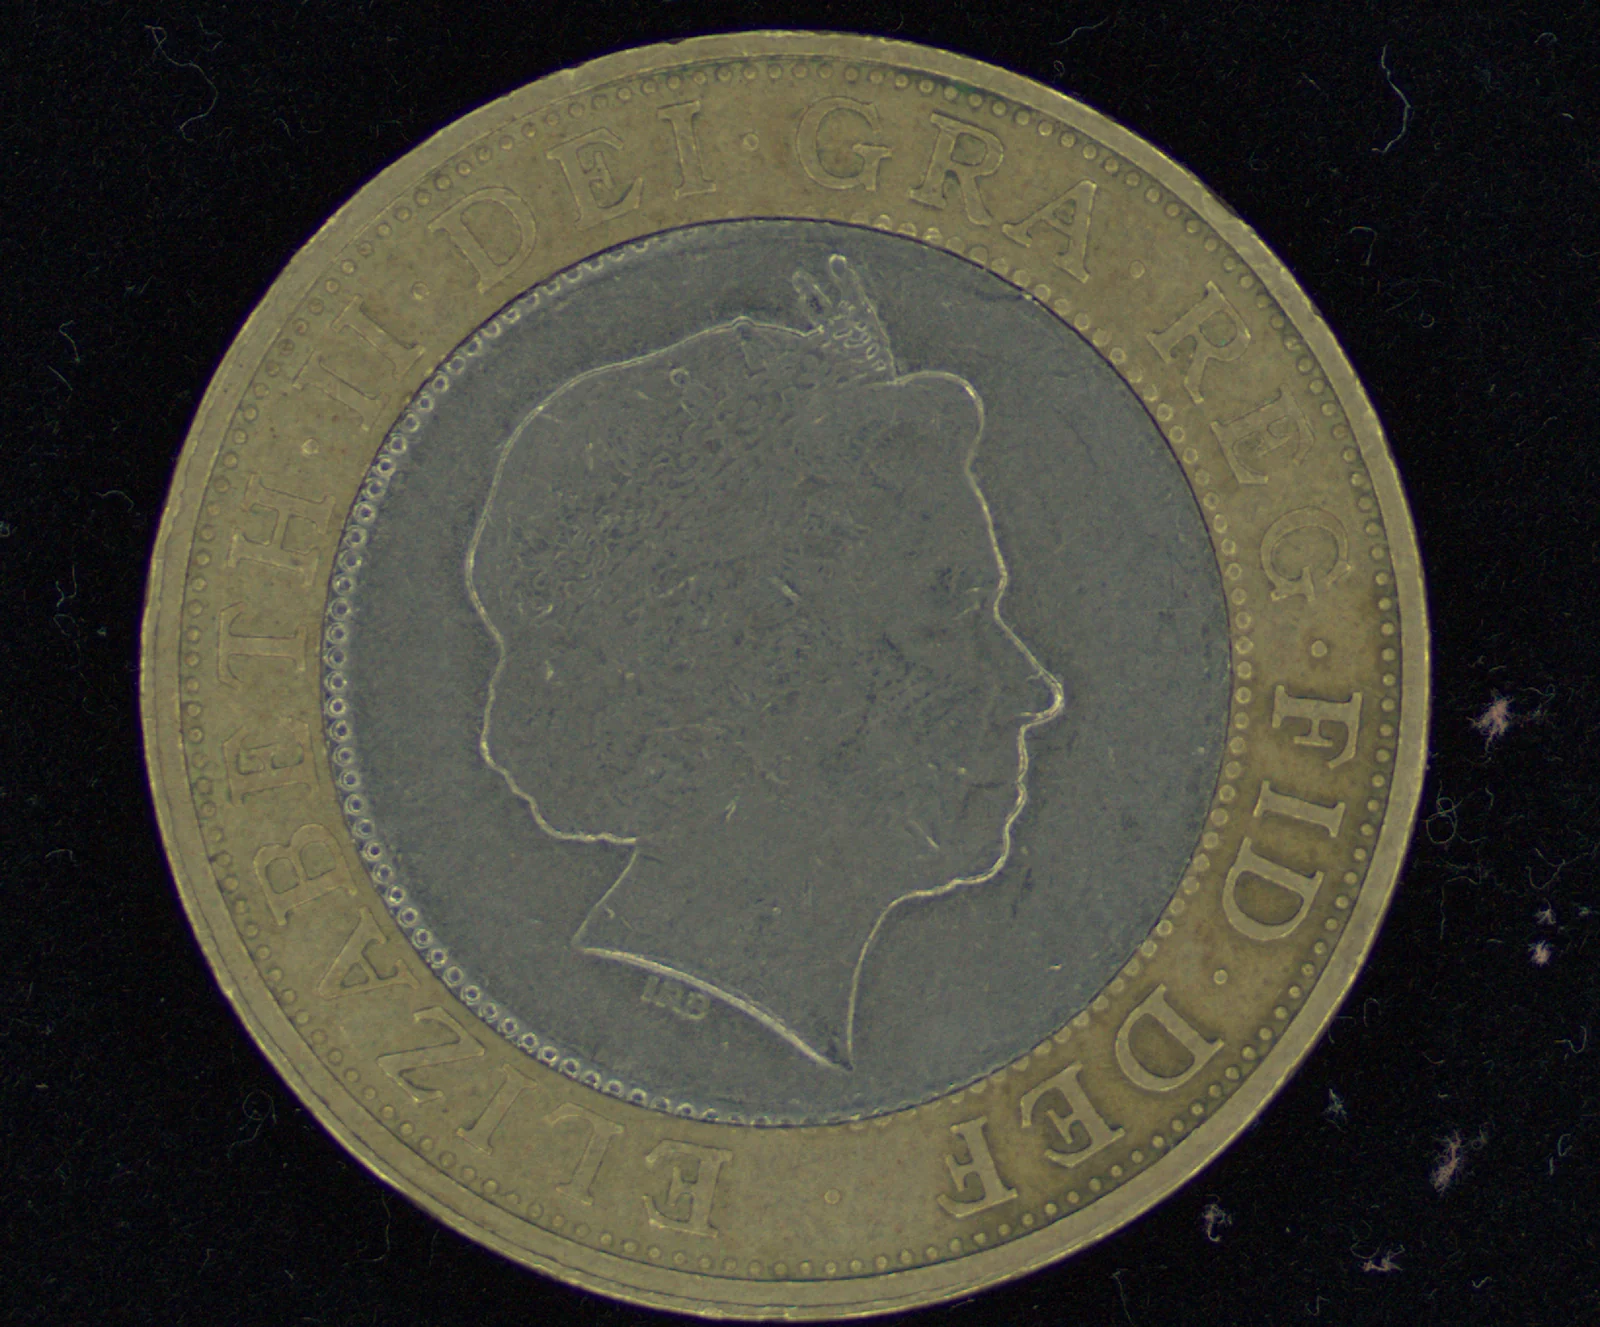
◀ Drag to compare ▶
The surface normal taken from a single capture. Everything this site claims begins here.
Explainers
Seven methods, in outline.
Not product specifications: the principle, and the limits.
Capturing — what the sensor measures
Move the light, and measure the direction a surface faces. What separates it from triangulation-based 3D, whether the result holds when the lighting changes, and how few images are enough.

Assemble height out of surface direction. Why adding from one edge leaves streaks, where the error accumulates, and whether height can be read in micrometres.
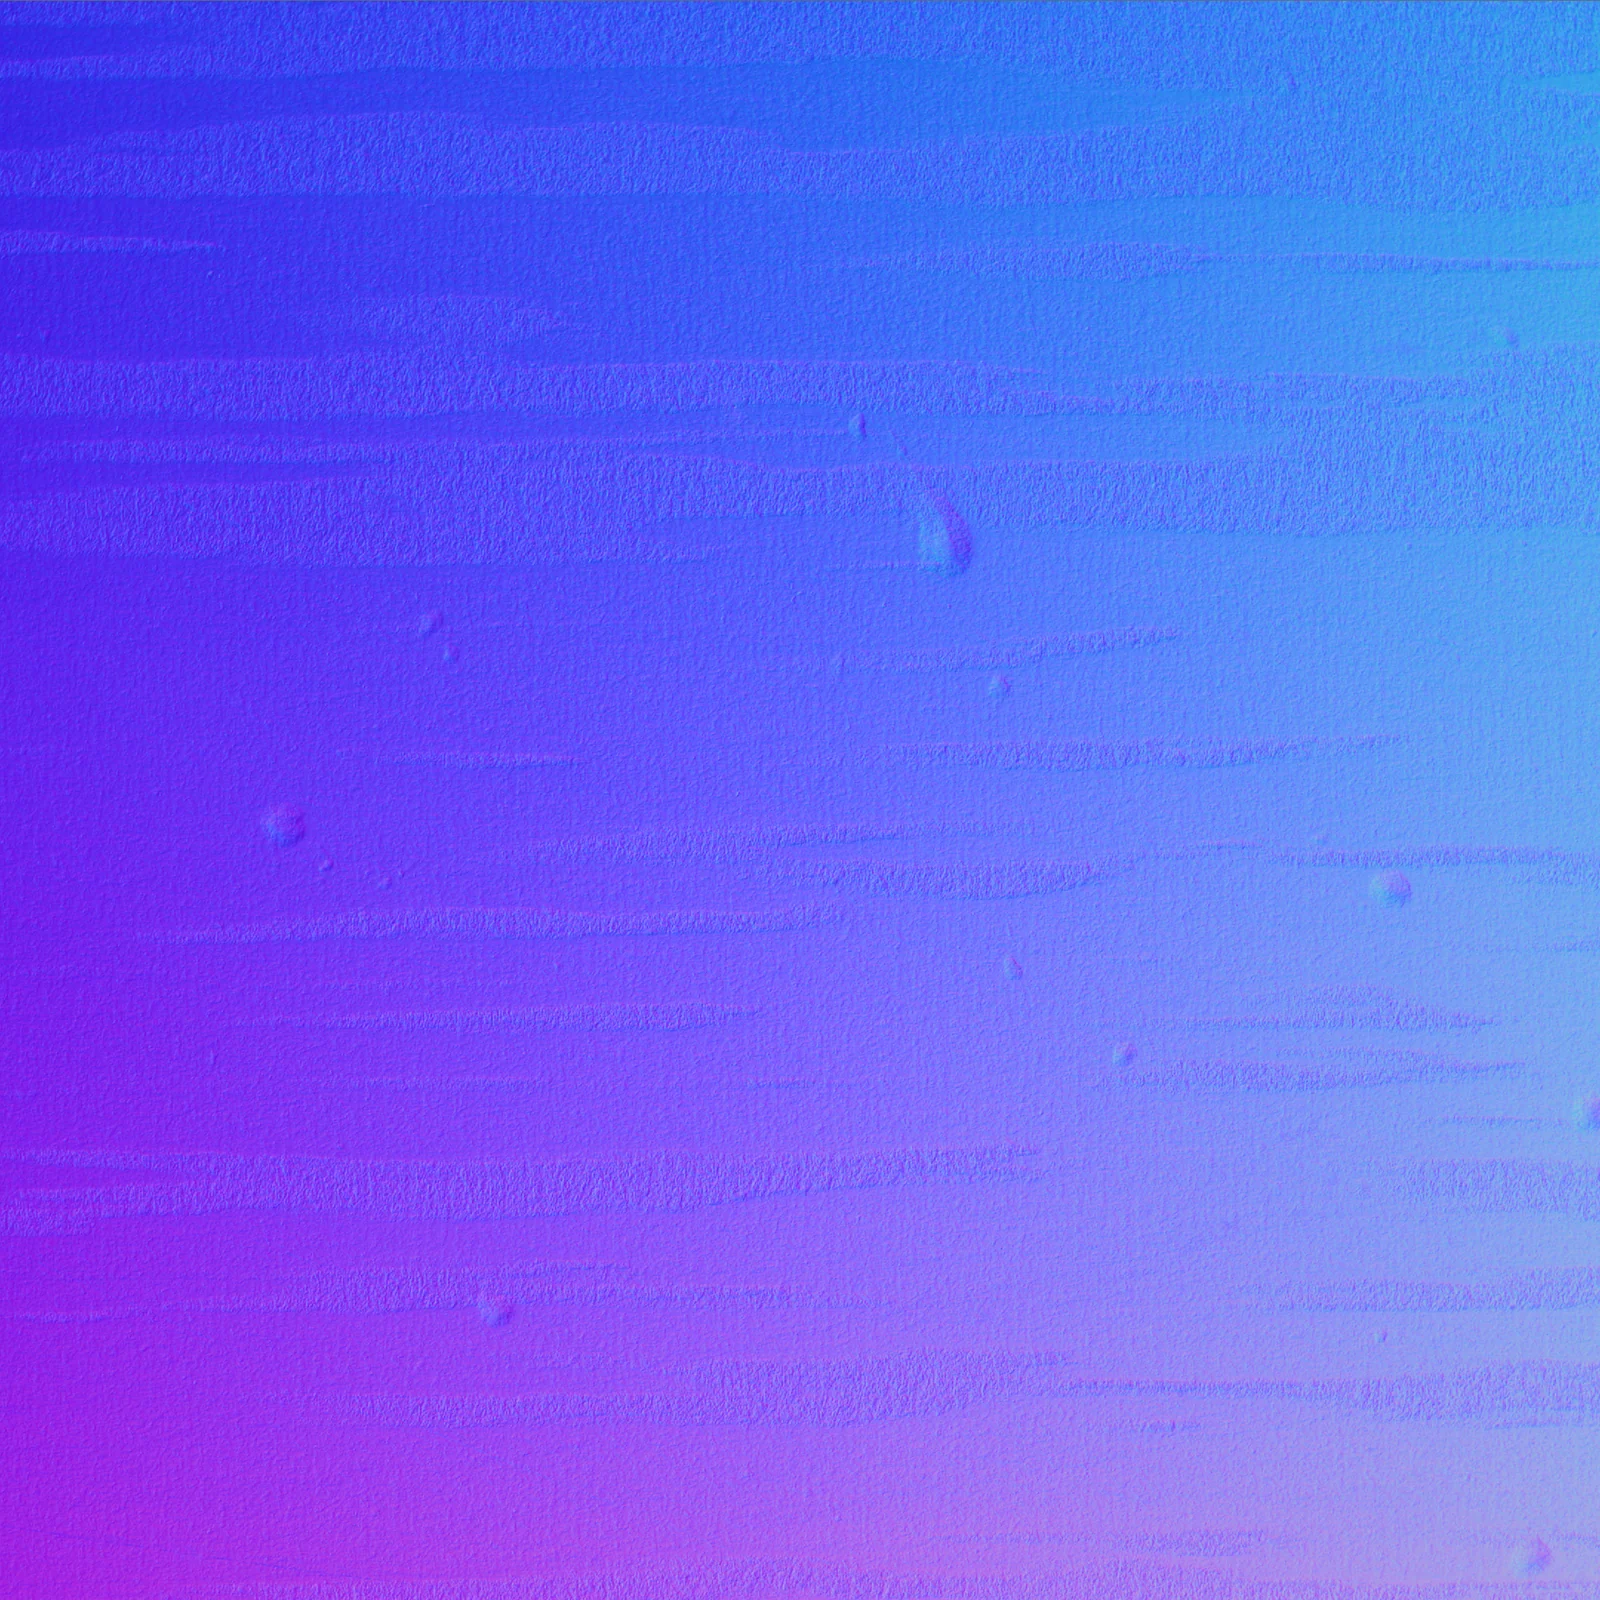
Using photometric stereo on something in motion, with a camera that takes one row at a time. What decides the vertical size of the image, whether an encoder is needed, how the lighting switch is synchronised, and how much data flows.
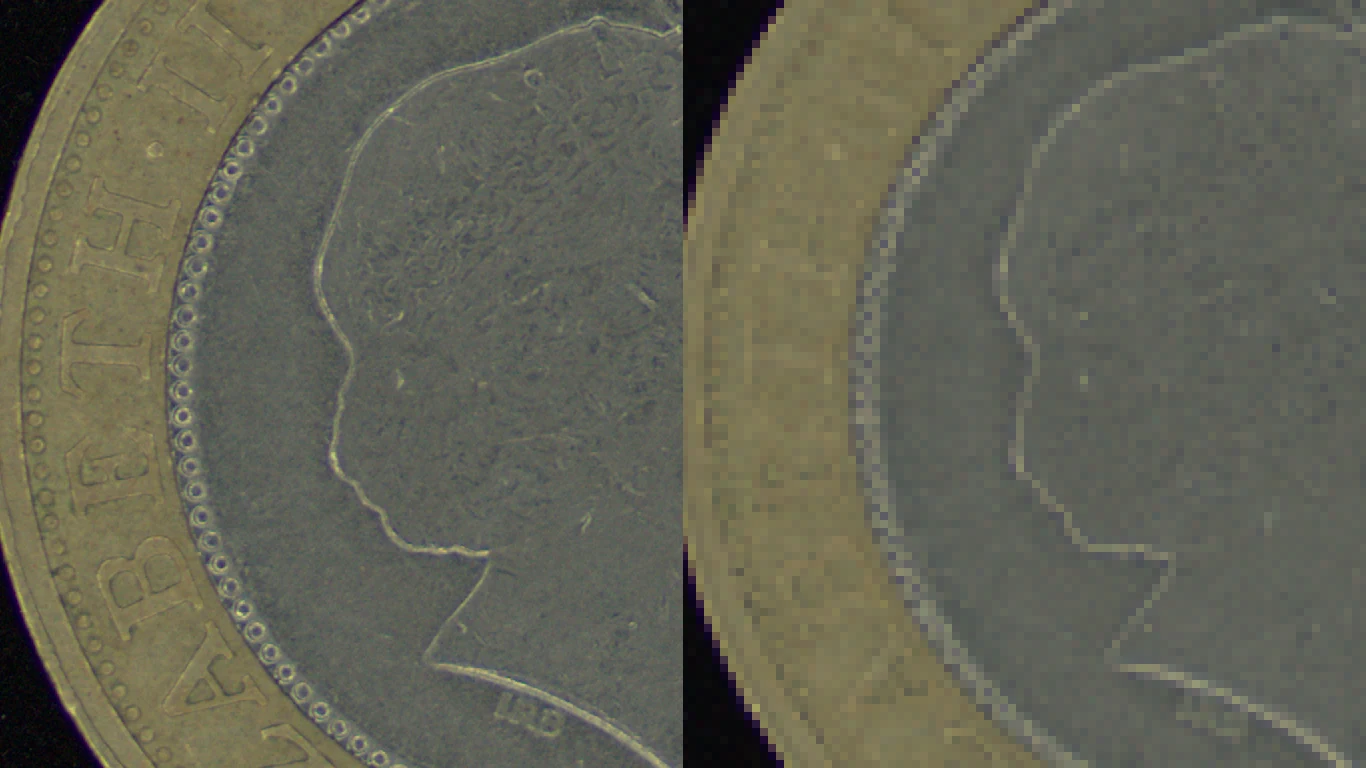
How small a flaw can be seen. The real size of one pixel, which is field of view divided by pixel count, and how many pixels a thing needs before it can be called visible.
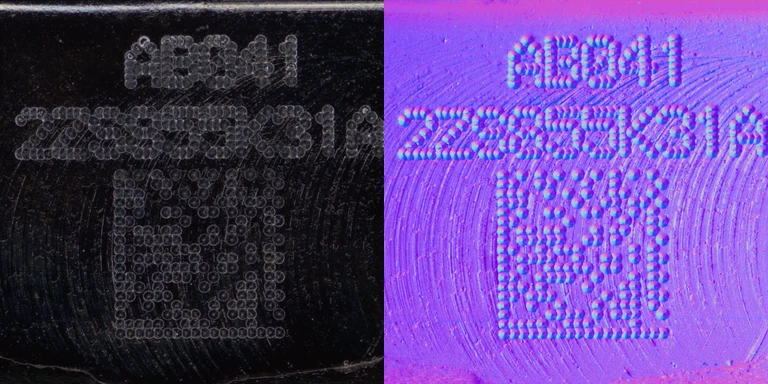
How black plastic, plated faces, transparent coatings and fine relief each come out. Six materials measured, so the difference between the photograph and the surface direction can be read directly.
Deciding — what the engine counts
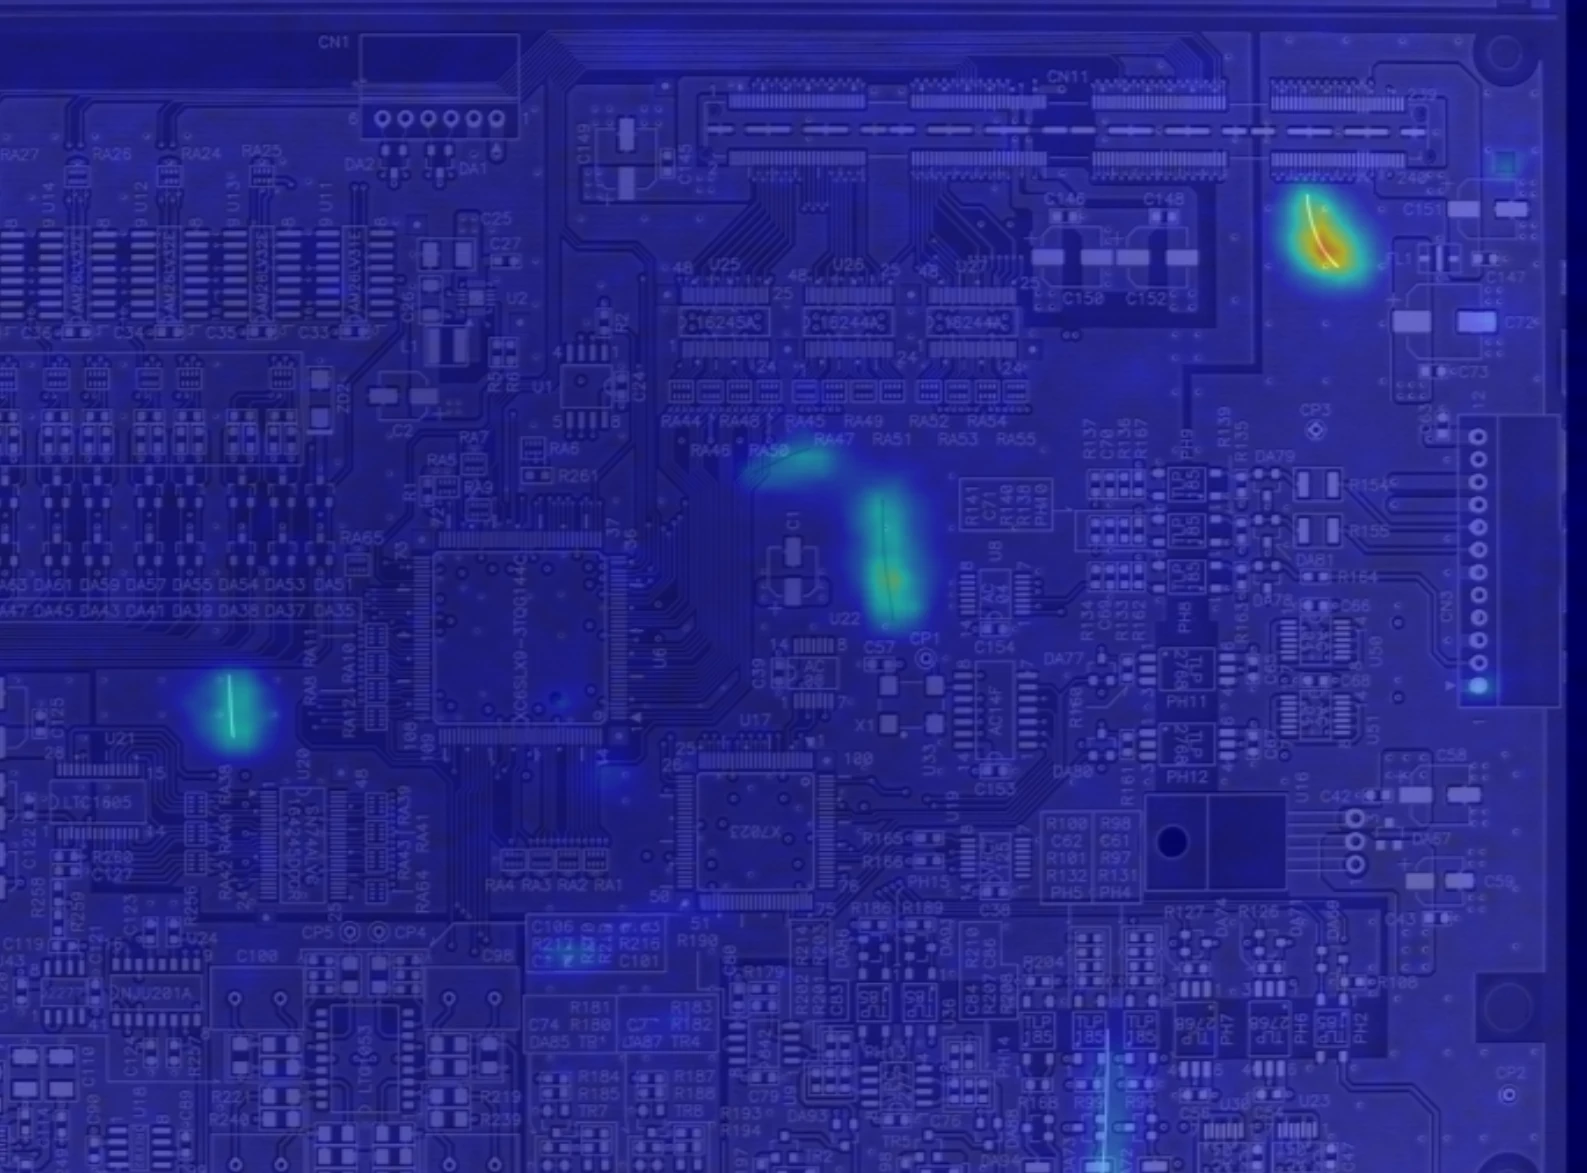
Learn good products only, and notice the difference. Whether a verdict is really possible without collecting defects, who sets the threshold, and what Human_Check is.
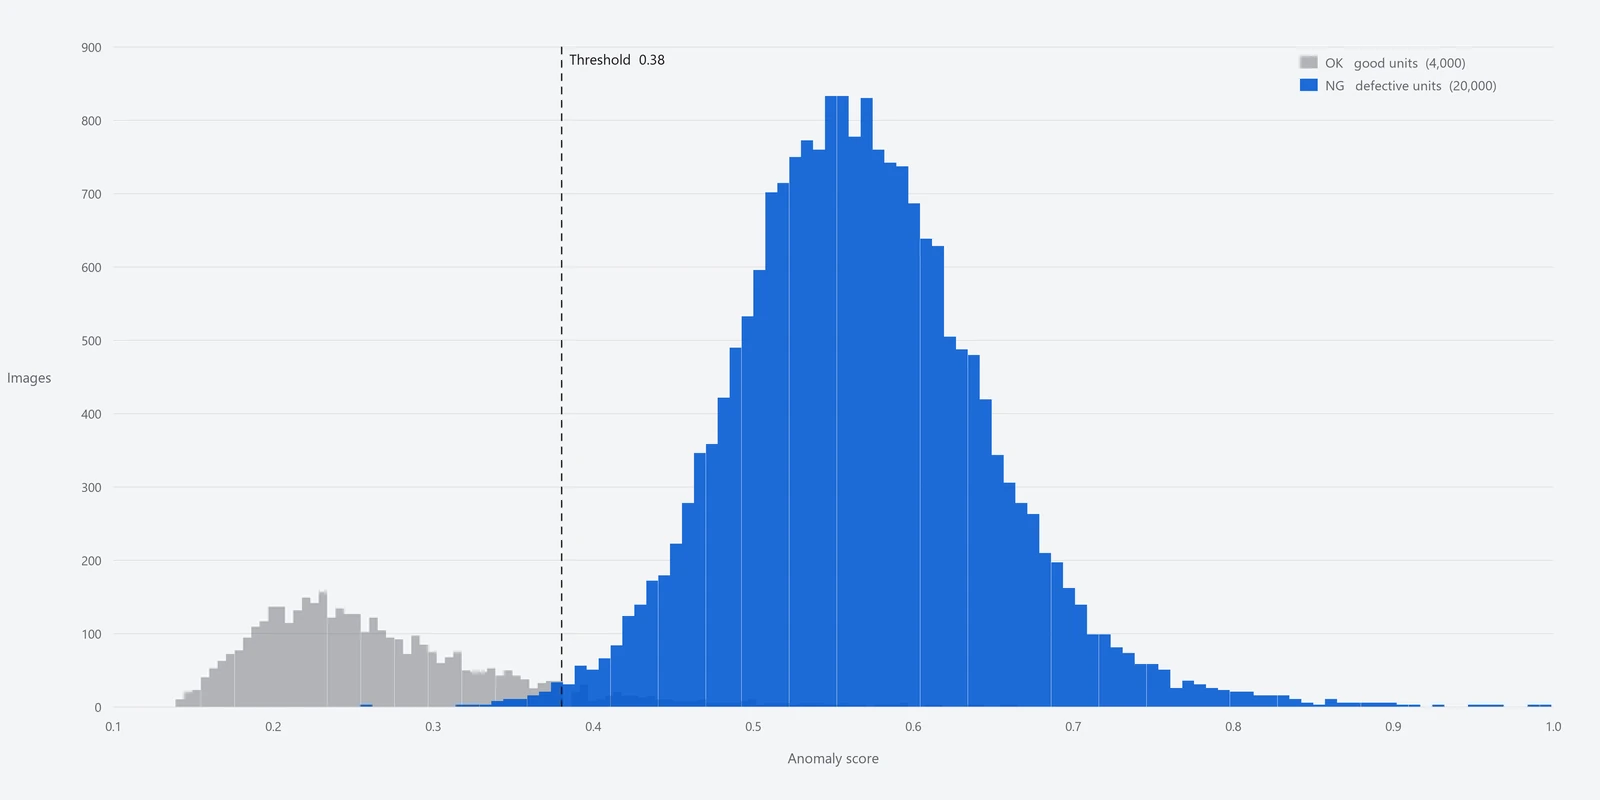
Why “what is the accuracy?” has no single-number answer. The trade-off between misses and false alarms, precision that moves with the defect rate on your line, and sample size against confidence.
※ On the Japanese site each of these methods has its own page, with blocks you can operate in the browser to check the claim for yourself. English versions of those explainer pages are 〔要確認〕. The questions below carry the same short answers.
Frequently asked
The questions we are asked,
with short answers.
These are the questions put to us across a table, kept as they are asked.
On capturing — photometric stereo
| Question | Short answer |
|---|---|
| How does it differ from an ordinary 3D camera (stereo, structured light)? | What is being measured differs. It solves for the direction of the surface at every pixel rather than the position of a point, so it is strong on fine relief and weak on large form. |
| Does the result hold when the lighting changes? | Surface direction does not depend on how the light falls. Starting from measured normals, the light can be moved afterwards to check this. |
| How few images are enough? | There are three unknowns, so 3 images solve it. More than that is for robustness against noise. |
| How many lighting directions do your systems have? | TR-100, in the area-camera configuration, has 8; TR-300, in the line-scan configuration, has 4. The equation needs three; the rest is against noise and shadow. |
| What comes out of a single capture? | Four outputs at once: Live / 2D Texture / 3D Surface / Surface Normal. |
| Aren't mirror and glossy faces a weakness? | Specular reflection falls outside the assumption. It needs handling — adding lighting directions and discarding those pixels as outliers, for example. |
| Can it capture on a moving line? | The method assumes N images overlap pixel for pixel, so not as it stands. It is made to work by switching the lighting row by row and re-aligning with an encoder. |
On resolution — how small it goes
| Question | Short answer |
|---|---|
| How small a flaw can be seen? | Not by the name of the system but by the real size of one pixel, which is field of view divided by pixel count. As a guide, three to four pixels per defect. |
| Why are two pixels not enough? | Taken down to the limit that separates two adjacent things (a period of two pixels), the measured contrast falls to a quarter of the original and is buried in noise. |
| How wide a field of view is possible? | It is the other side of the same division. Widen the field and one pixel grows, and the smallest visible size grows with it. |
| What is the smallest flaw in micrometres? | It does not reduce to one number; it follows from the resolution and the shape of the defect. On a representative TR-300 configuration (8K, 100 mm field, so 12.2 μm per pixel), the measured level at which 70% of contrast survives is a width of about 49 μm. Widen the field to 300 mm and it becomes about 146 μm. |
| Does adding pixels make it visible? | It plateaus. If the lens is not resolving, if it is outside the depth of field, or if the difference from the surroundings is smaller than the noise, more pixels will not bring it back. |
| The capture is good enough, so why is it not detected? | Resolution is not a single thing. Images are resized to a fixed pixel count before the decision, and it coarsens once more there. |
On the object — what appears and what does not
| Question | Short answer |
|---|---|
| Can it see a completely black part? | Yes. Blackness does not break the assumption; it is a question of how much light returns, which exposure and lighting reach. In a measured black plastic the median brightness was 19/255, and the marking still stands up as shape. |
| Can it see through a transparent coating? | If something under the coating returns light, yes. In enamelled wire the directions of both the coating and the strands mix, and a crushed coating shows as a disturbance of the stranding. The surface of a transparent body itself is a weakness. |
| What about shiny plated or mirror faces? | Specularly reflecting pixels fall outside the assumption. Where only part of the face shines, adding lighting directions and discarding outliers works; a mirror itself is a weakness. |
| Why is something visible that a photograph cannot show? | Because what is measured differs. Among six materials, steel sheet had the smallest variation in brightness (σ 4.6/255) and the largest variation in surface direction. |
| How does a matte textured finish appear? | We have measurements of regular relief (rubber sheet), but no example yet of a random matte texture. We will answer with a trial capture. |
On height — 3D reconstruction
| Question | Short answer |
|---|---|
| How does surface direction become height? | By integrating the slope (p, q). Not by adding from one edge, but by solving all pixels together in a least-squares sense. |
| Can the height in 3D Surface be read in micrometres? | No. Integration fixes relative differences in height; absolute dimensions need the real pixel size and a separate reference. |
| Can it see warp and waviness? | That is a weakness. Error gathers at long wavelengths, so our 3D Surface deliberately removes waviness and keeps the fine detail — scratches, marking. |
On the line — line scan cameras
| Question | Short answer |
|---|---|
| What happens to the image when the conveying speed changes? | It stretches or compresses vertically, because the vertical pixel size is the distance travelled while one row is captured. Synchronise to distance with an encoder and it stops depending on speed. |
| Is an encoder necessary? | Yes. The distance travelled is the cue that starts the lighting switch and the camera exposure at the same moment. |
| What happens if the lighting switch drifts? | Each direction images a different place, and the normals break up into stripes. That error cannot be recovered by re-alignment. |
| How much data flows? | width × bytes × line rate. At 4,096 pixels, 1 byte and 3,300 Hz, about 108 Mbps. Switching four directions makes it four times that. |
| How long does the processing take? | 30 ms to generate the 3D image (4MP × 4 images, RTX 3060 6GB). With the AI decision, 60–80 ms. Processed on a GPU and a PC, without FPGAs or dedicated boards. |
| How fast a line can it capture? | The published figures are 40–100 m/min (in our literature) and up to 200 m/min (the TR-300 announcement). The difference in conditions is being checked. |
On deciding — anomaly detection
| Question | Short answer |
|---|---|
| The capture is good enough, so why is it not detected? | Images are resized to a square of fixed pixel count before the decision, so it coarsens once more there. The score map is a further 1/8 grid of the input (at a 512-pixel setting, 62 × 62). |
| Can it really decide without collecting defect images? | Training uses good pieces only. It picks up whatever stands at a distance from the memory of good, so it reacts to kinds of defect nobody anticipated. |
| How many good pieces are enough? | Not a fixed number, but enough to cover the spread of good pieces. Real projects used 122 good pieces (circuit board) and 63 (enamelled wire). |
| Who sets the threshold, and how? | It is calibrated on evaluation data containing both good and defective pieces. A line cannot be drawn without seeing a single real defect. |
| What is Human_Check? | A three-way verdict that returns the band which is neither clearly good nor clearly defective to a person. How wide that band is set is a decision on the floor; the wider it is, the more pieces a person looks at. |
| Does it tell you the type of defect? | No. What comes back is how far away it is and where; it does not classify the kind. |
| What happens if the lighting or the line changes? | Any change not in its memory appears as an anomaly. If the imaging conditions change, the assumption is that a new model is trained. |
| Live or Surface Normal — which should it decide on? | It depends on the object. We publish score maps for the same enamelled wire with only the input swapped. |
| How long does a decision take? | About 29 ms per image at inference (RTX 3090, image size 256, public dataset MVTec AD, our measurement). The value changes with the conditions. |
On evaluation and service — reading the numbers
| Question | Short answer |
|---|---|
| What is the accuracy? | There is no single-number answer. Where the threshold is put trades misses against false alarms. We will show you the distribution and the operating point. |
| Why is the NG bin mostly good pieces? | On a process with a low defect rate, even a small false-alarm rate makes most of the NG bin good pieces. That is the population at work, not the model. |
| Can you say “100% accuracy”? | No. Getting all five defective pieces right still only puts the true detection rate somewhere in 56.6–100%. Pushing the lower bound past 99% takes around 500 pieces. |
| What do we do if false alarms increase? | Three moves: raise the threshold, train on additional good pieces, or narrow the region looked at. Which one follows from where the response is appearing. |
| What if the lighting or the lot changes? | Every change it has not learned appears as an anomaly. The distribution of good pieces has moved, so this is retraining, not threshold adjustment. |
※ The short answers are summaries. Every figure is our own measurement, quoted from the places where the measurement conditions are given alongside it.
White paper
Not an explanation.
A record of measuring it.
Everything above describes what the method is. One study measured whether it actually works.
The anomaly detection algorithm (E3 ENGINE) and its parameters were held completely fixed, and only the input was changed from the LIVE image to the 3D Surface of FORESIGHT STEREO, across 128 images of the same part. One thing changed: the input channel.
It also reports where it did not work — why misses rose from none to four, why at the defect rate of a real line more pieces go to human check than with LIVE, and why LIVE can be the better choice when a single threshold is used.
An English edition of the report is 〔要確認〕.
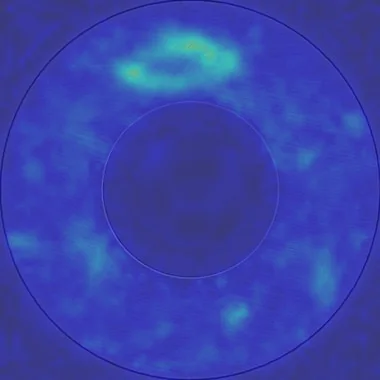
Seen through LIVE, the response on the same part bleeds across the whole ring; seen through 3D Surface it converges on the actual position of the defect (above is the 3D Surface side).
| ROC AUC | 0.935 → 0.970 |
|---|---|
| Overlap between good and defective scores | 0.37 → 0.06 |
| False alarm rate (at the optimal threshold) | 34.3% → 17.1% |
Values on a test set under identical conditions (n=128, a single part). They do not guarantee equivalent performance for every object or environment.
Where they sit
The methods, and the products.
The explanations are about method. The products are those methods made to work on a floor. Here is which of the three layers each belongs to.
FORESIGHT STEREO®
A 3D imaging technique developed from photometric stereo. From illumination in many directions it takes the surface normal, independently of the lighting, and recovers 3D shape.
E3 ENGINE®
The anomaly detection engine. It learns from good products only and returns OK / Human_Check / NG. Product page →
TR series
The systems that carry the sensor and the decision, chosen to suit the conditions on the floor. See products →
Contact
The quickest answer
is to image it.
Whether a method suits your object is settled by capturing it. Tell us the surface finish, the size of what you need to catch and the conditions on your line, and we will work it out with you.