Time Series Anomaly Detection: Evolution Over the Last Decade and Prospects for the Future
Time Series Anomaly Detection: Evolution Over the Last Decade and Prospects for the Future
This article is based on the comprehensive review paper “Dive into Time‑Series Anomaly Detection: A Decade Review (2024)” by Paul Boniol, Qinghua Liu, Mingyi Huang, Themis Palpanas, John Paparrizos, and others.
Introduction
Have you ever stopped to think about the phrase “time series data” in your daily life? In fact, time series data is everywhere around us. Examples include heart rate measurements from a smartwatch, stock price fluctuations in a smartphone app, temperature changes in a weather forecast, and machine operation logs from IoT devices in factories. All of these are data recorded sequentially over time—i.e., time series data.
Analyzing enormous amounts of time series data has become essential across numerous fields: astronomy, biology, economics, medicine, engineering, environmental science, cyber-security, financial markets, and law enforcement, to name a few. Detecting unusual patterns—so-called “anomalies”—in this data is known as time series anomaly detection.
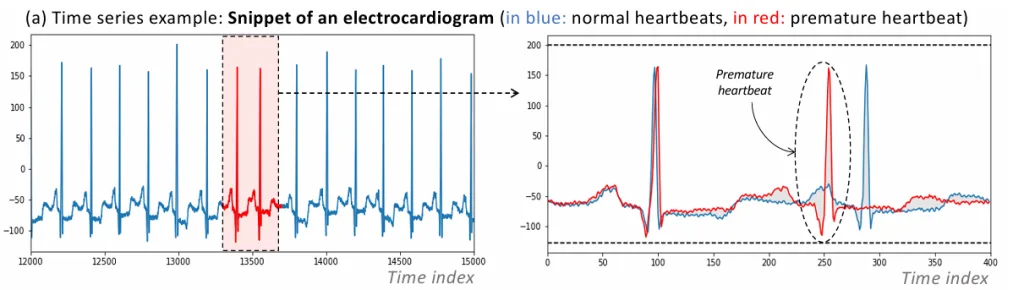
Why is anomaly detection so important? Because anomalies are not always mere “noise” or measurement error—they can sometimes signal truly significant events such as failures, fraud, cyberattacks, or unexpected behavioral changes. For instance, detecting premature cardiac contractions in ECG data can aid patient monitoring and early warning systems. Identifying anomalies in engine disk rotations or abnormal cycles in a space shuttle’s Marotta valve can help predict mechanical failures and avert unplanned shutdowns. Thus, anomaly detection is indispensable for optimizing system performance, enhancing security, mitigating risks, and providing early warnings for critical events.
However, anomaly detection poses a major challenge: anomalous data is overwhelmingly rarer than normal data. Accurately identifying these rare events requires approaches distinct from those used in conventional machine learning tasks.
In this article, we explore the rapidly advancing field of time series anomaly detection, focusing particularly on trends over the past decade. We explain the underlying mechanisms, main algorithms, evaluation techniques, and future directions in a way that’s accessible even to readers without specialized machine learning expertise.
What Is an Anomaly? Unique Characteristics in Time Series Data
In time series data, an “anomaly” is defined as a data point or a group of points that deviates significantly from normal behavior or from what would be expected based on previously observed data. Academic literature describes anomalies using terms like outliers, novelties, exceptions, peculiarities, deviants, or discords.
Anomalies can have two major interpretations:
- Noise or corrupt data: These are undesirable errors or artifacts that should be cleaned or corrected during preprocessing—such as temporary sensor glitches or transmission errors.
- Meaningful, interesting events: These represent rare but critical phenomena—like failures or behavioral shifts—and are the primary targets of analysis. Examples include fraudulent financial transactions or sudden surges (or drops) in website traffic.
Anomalies in time series can be further categorized by their occurrence patterns:
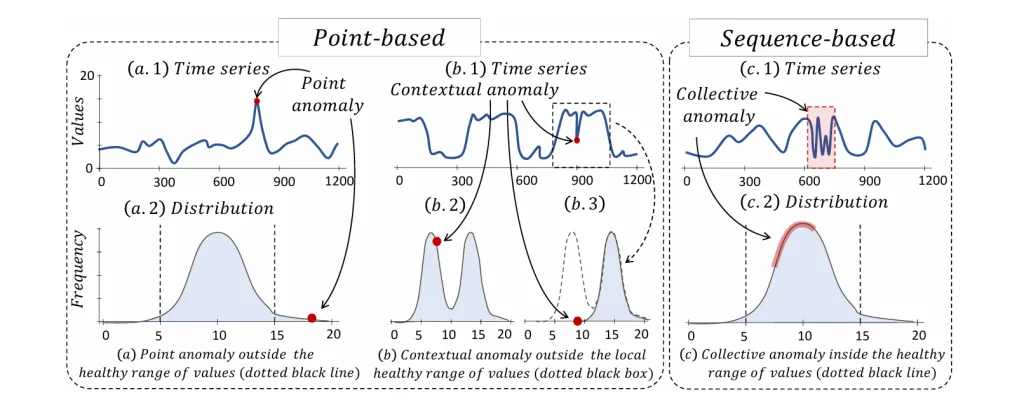
- Point Anomalies: Individual data points that deviate sharply from others—e.g., sudden spikes in web traffic.
- Contextual Anomalies: Points that may appear normal in value but are anomalous in context—e.g., typical traffic volume during midnight hours.
- Collective Anomalies: Sequences of data points that collectively form an anomalous pattern—even if individual points seem normal—such as an unusual ECG waveform.
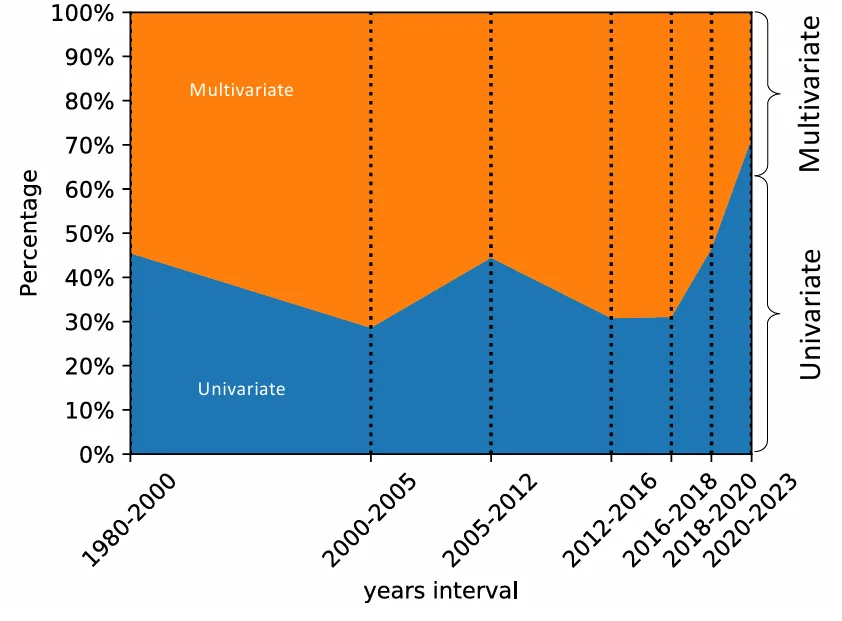
Time series data is also distinguished by dimensionality:
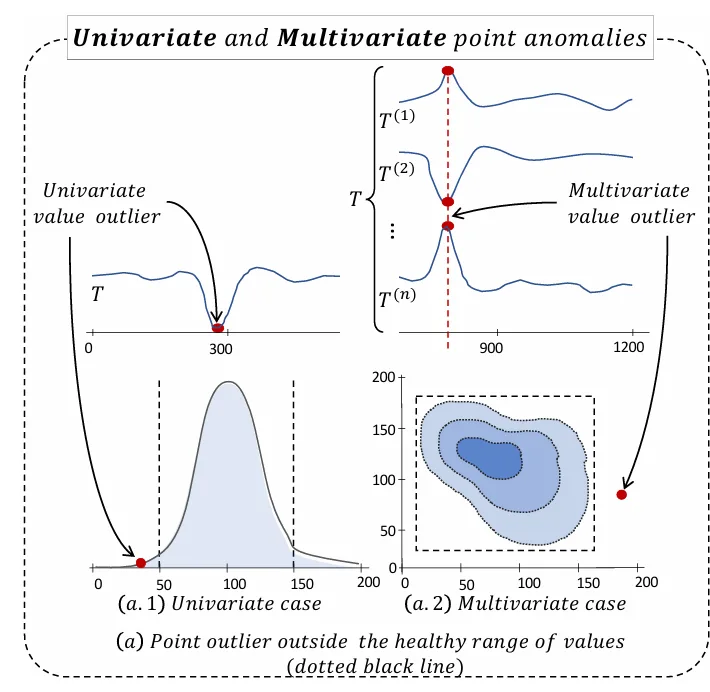
- Univariate: Single-variable series (e.g., temperature, stock closing price), where anomalies are detected based on a single dimension.
- Multivariate: Multiple variables recorded together (e.g., weather parameters like temperature, humidity, pressure, or data from multiple sensors), where anomalies can emerge from relationships across variables—even if each individual variable seems normal.
The Anomaly Detection Pipeline
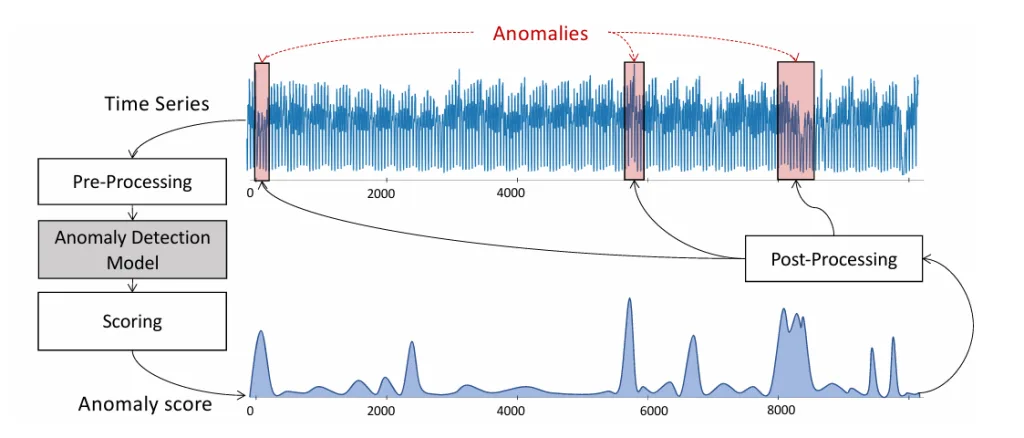
Detecting anomalies in time series requires a structured approach, especially in fields like cybersecurity, finance, or healthcare. We can break it down into four key steps, forming a time series anomaly detection pipeline:
-
Data Pre-processing
Transform raw time series into a format suitable for analysis—often using a sliding window to split the series into sub‑sequences treated as multidimensional points. Additional preprocessing may include statistical feature extraction, model preparation, normalization (e.g., z‑score), or seasonal decomposition (e.g., STL). -
Detection Method
Apply a specific anomaly detection algorithm—such as distance‑based, density‑based, or prediction‑based methods. This might involve computing distances between windows, setting classification boundaries, or measuring reconstruction or prediction errors. -
Scoring
Convert raw output into a numerical anomaly score per data point or sub‑sequence—indicating how much it deviates from normal behavior. Examples include prediction errors or isolation distances. This produces a time series of anomaly scores aligned with the original series. -
Post-processing
Identify actual anomalies from the score series—usually by applying a threshold. Thresholds can be fixed, statistical, or adaptive. This step finalizes which segments are flagged as anomalies.
This pipeline helps structure the process and compare different algorithms at each stage.
Diverse Approaches to Anomaly Detection Algorithms
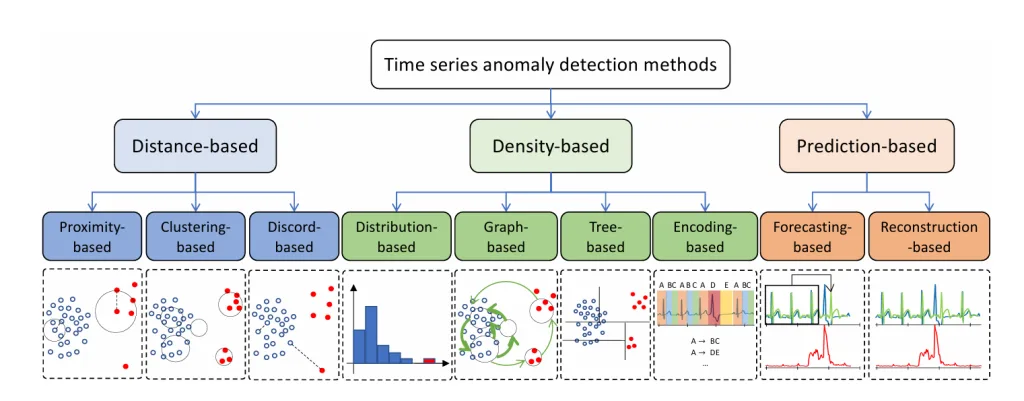
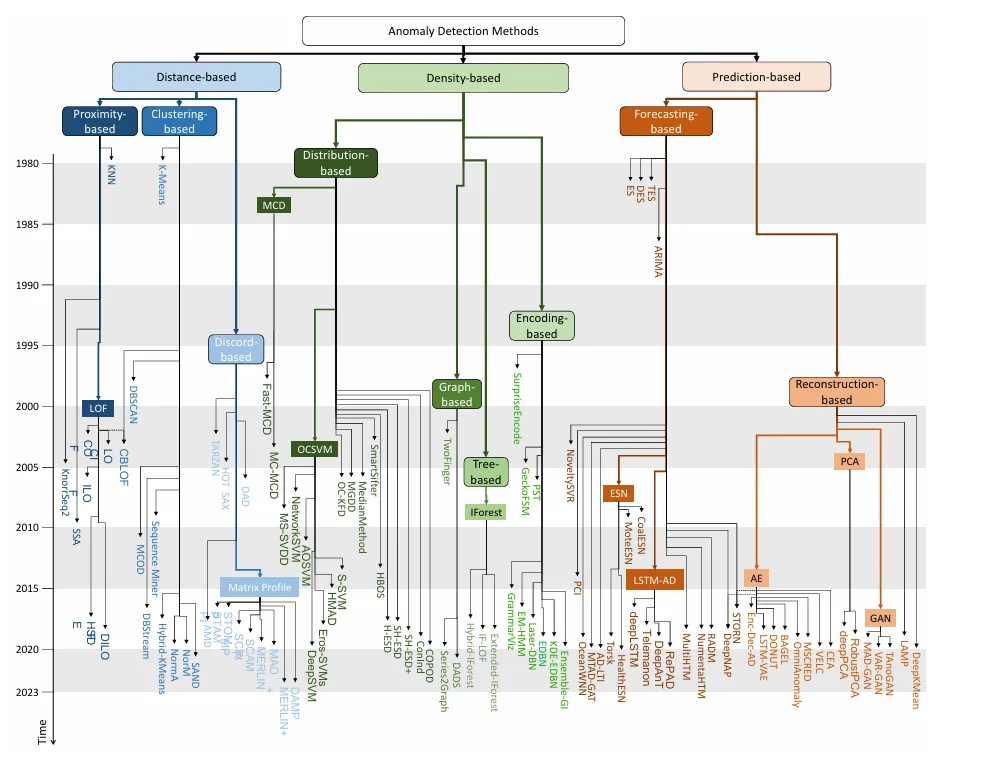
Because anomalies are rare, most algorithms focus on learning the normal pattern and flagging deviations. These methods fall into three broad categories:
-
Distance-Based Methods
- Proximity-based: Measure how isolated a point/window is—e.g., K‑Nearest Neighbors (KNN) uses distance to the Kᵗʰ nearest neighbor; Local Outlier Factor (LOF) compares local density against neighbors.
- Clustering-based: Identify points not belonging to any cluster or belonging to small clusters—e.g., K‑means, DBSCAN, etc.
- Discord-based: Detect “strange” subsequences far from their nearest neighbors—e.g., Matrix Profile.
-
Density-Based Methods
- Distribution-based: Model the statistical distribution of normal data—e.g., One‑Class SVM (OCSVM) separates normal data in feature space.
- Tree-based: Partition the data using trees—e.g., Isolation Forest (IForest) isolates anomalies quickly.
- Encoding-based: Transform data to a latent space—e.g., PCA identifies deviations in principal component reconstruction.
-
Prediction-Based Methods
- Forecasting-based: Predict future values using models like LSTM or GRU and flag large prediction errors.
- Reconstruction-based: Use models like Autoencoders (AE) or GANs to reconstruct data—failures in reconstruction signal anomalies.
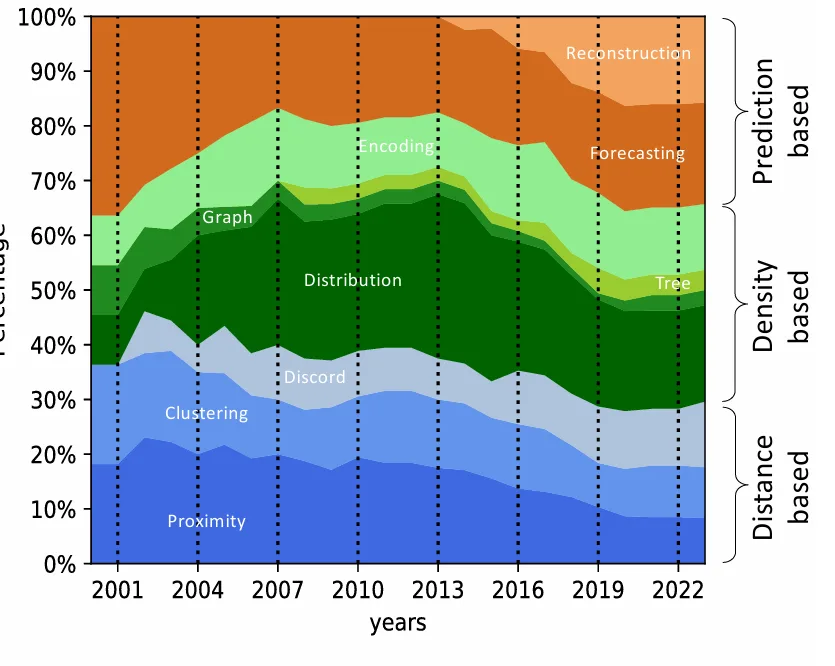
Trends Over the Past Decade
Since 2016, research in time series anomaly detection has surged, especially in prediction‑based methods using deep learning (LSTM, autoencoders) powered by frameworks like TensorFlow and PyTorch.
Interestingly, earlier research often addressed multivariate anomalies, but in recent years, univariate methods have predominated, possibly due to the added complexity of defining and detecting collective anomalies in multivariate series.
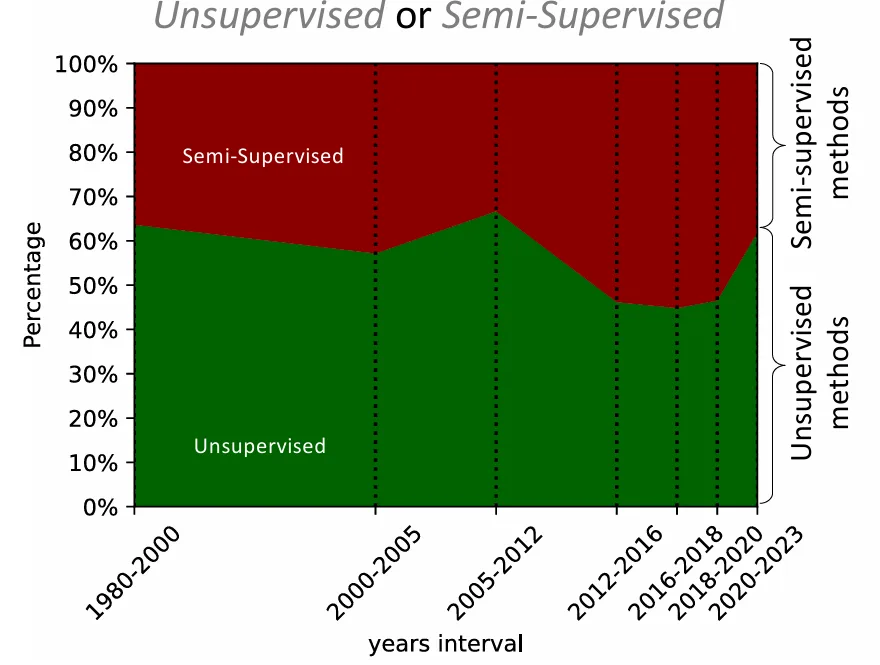
Moreover, methods are categorized by label availability: unsupervised, semi‑supervised, or supervised. Given the scarcity of labeled anomalies, unsupervised and semi‑supervised approaches dominate, with semi‑supervised methods gaining momentum recently.
Benchmarks and Metrics for Algorithm Evaluation
No single method works best everywhere. To ensure fair evaluation, we rely on benchmark datasets and evaluation metrics:
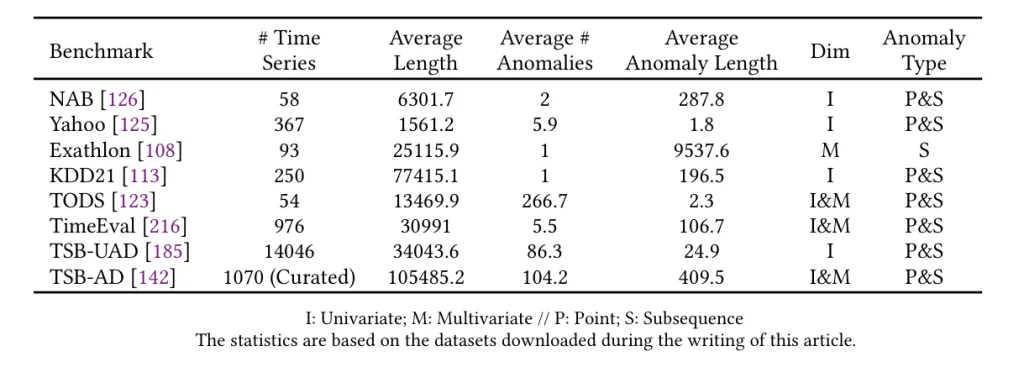
Benchmark Datasets:
- NAB (Numenta Anomaly Benchmark): 58 labeled real-world & synthetic series—real-time focus.
- Yahoo S5: Real and synthetic series from Yahoo’s production systems.
- Exathlon: High-dimensional series for explainable anomaly detection.
- KDD21 (UCR Anomaly Archive): Mixed-domain series.
- TODS: Covers five anomaly scenarios—point, contextual, pattern anomalies.
- TimeEval: 71 detection methods evaluated over 967 series.
- TSB-UAD: Univariate benchmark simulating different anomaly types.
- TSB-AD: Largest benchmark with 1,000 curated series (both uni‑ and multi‑variate).
These benchmarks address flaws in earlier ones—like label errors or unrealistic anomaly densities—by offering robust and reliable evaluation frameworks.
Evaluation Metrics:
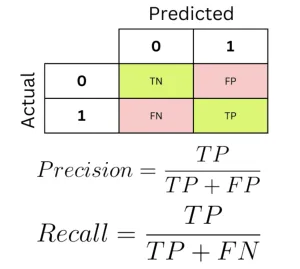
- Threshold-based: Convert anomaly scores to predictions via a set threshold; compute precision, recall, F1-score, etc., from confusion matrix entries.
-
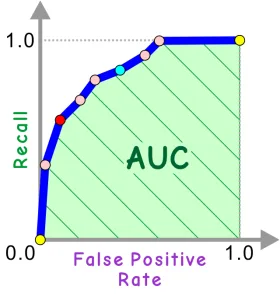
Threshold-independent:
- AUC-ROC and AUC-PR: Useful in imbalanced data scenarios; AUC-PR often preferred.
- Range-AUC: Addresses sequence anomaly evaluation by allowing buffer regions around anomaly intervals.
- VUS (Volume Under Surface): Parameter-free, robust metric that integrates over Range-AUC buffer settings.
Conclusion
Although time series anomaly detection has seen extensive research, it remains a highly challenging field. Diverse methodologies make uniform comparison difficult—but comprehensive benchmarks like TSB-AD and TimeEval are bridging that gap, enabling better selection of methods based on specific tasks.
Future directions include:
- Establishing a unified benchmark with diverse, well-labeled series and anomaly types.
- Leveraging ensemble learning and AutoML to combine multiple algorithms and automatically select the best models.
- Developing robust methods for more complex data (missing values, irregular timestamps, heterogeneous data, streaming data), particularly in multivariate and streaming contexts.
As data collection technologies and algorithms both advance, time series anomaly detection will only grow in significance. I hope this review helps deepen your understanding and inspires you within this exciting field.
References
- Boniol, P., Liu, Q., Huang, M., Palpanas, T., & Paparrizos, J. (2024). Dive into Time‑Series Anomaly Detection. arXiv:2412.20512
- Bajaj, A. (2025, April 24). Anomaly Detection in Time Series. Neptune Blog.
- Schmidl, S., Wenig, P., & Papenbrock, T. (2022). Anomaly Detection in Time Series: A Comprehensive Evaluation. PVLDB, 15(9), 1779–1792.