
Logical Anomaly Detection Rankings Flip When Artificial Capture Shifts Are Mixed In
 kotai2003
In visual inspection on production lines, AI finds defects by looking for “differences from good parts.” The task of finding rule violations, such as missing or misplaced components, is called logical anomaly detection. It is a different task from structural anomaly detection, which looks for visible defects such as scratches and stains. On the standard benchmark MVTec LOCO, there are already methods with near-perfect AUROC (a metric of how well normal and anomalous samples are separated: 50% is chance, 100% is perfect). However, those scores were measured on images taken under fixed capture conditions. On a real line, both lighting and camera position change. A paper by Efe and Temizel shows that adding this “variation in conditions” to the test changes the rankings.
A leaderboard is only the result of one test
The authors randomly assigned one of seven conditions to each test image and mixed them. The seven are: unmodified; three levels of reduced brightness (0.8x, 0.6x and 0.4x); and three levels of shrinking the image by 5%, 10% and 15% (zoom-out). A single AUROC is computed over the whole mixed set (averaged over 100 random assignments), because a real system uses the same threshold regardless of conditions. The value measured on unmodified images only is called clean (it is not an average over the mixed conditions). Figure 1 shows the difference between clean and mixed, averaged over five categories.
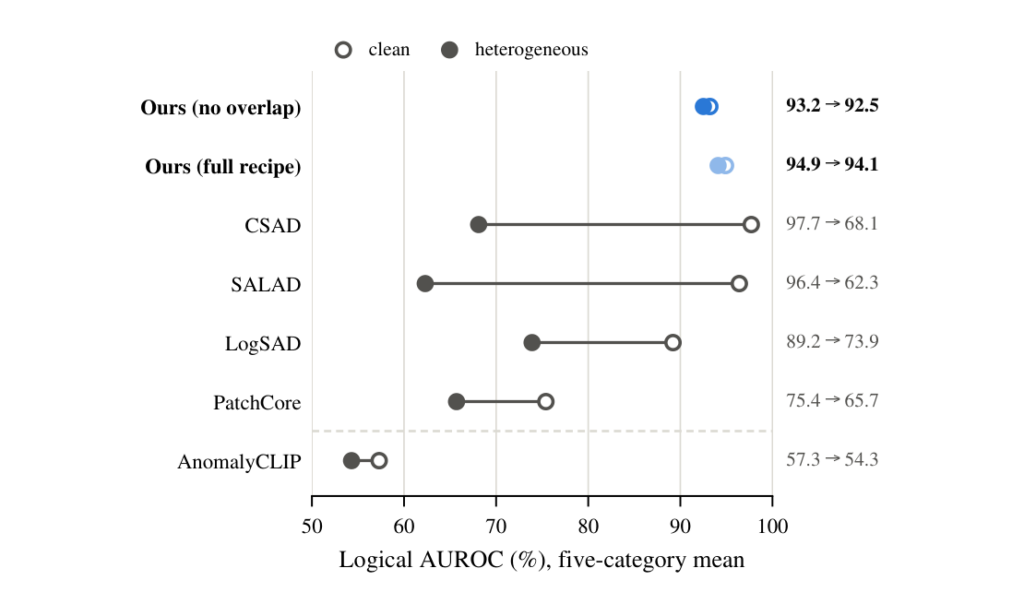
Source: Ufuk Efe, Alptekin Temizel, "Robust Logical Anomaly Detection under Capture Shifts via Synthetic Anomalies", Figure 1. https://arxiv.org/abs/2610.18295 (arXiv non-exclusive license; reproduced unmodified as a quotation)
CSAD, one of the top methods on clean, dropped from 97.7 to 68.1. SALAD also dropped, from 96.4 to 62.3. Under mixed conditions, both of these methods are overtaken even by LogSAD (89.2 to 73.9). The clean leaderboard alone does not reveal this reversal.
Why they break down, and the idea behind the proposed method
The methods that break down score images by their distance from the normal training images (the authors call these normal-reference methods). According to the authors, a dark image or an object that appears smaller looks far from normal even when the parts are correct, so it is scored as more anomalous. In the paper’s analysis, under strong perturbations, most normal images for CSAD and SALAD score higher than the median of the clean anomalous images.
The proposed method makes its decision without comparing against normal images. In the upper part of Figure 2, an LLM generates anomaly types and editing instructions from a human-written product description. An image-editing model modifies normal images, and a person, assisted by a VLM, keeps only the valid edits. In the Pushpins example, an image with two pins in one compartment is created to violate the rule “one pushpin in each of the 15 compartments.” In the lower part, the normal images are automatically grouped into clusters of similar images, and a classifier is trained to distinguish the normal clusters from the anomaly types. The sum of the probabilities of all non-normal classes is the anomaly score.
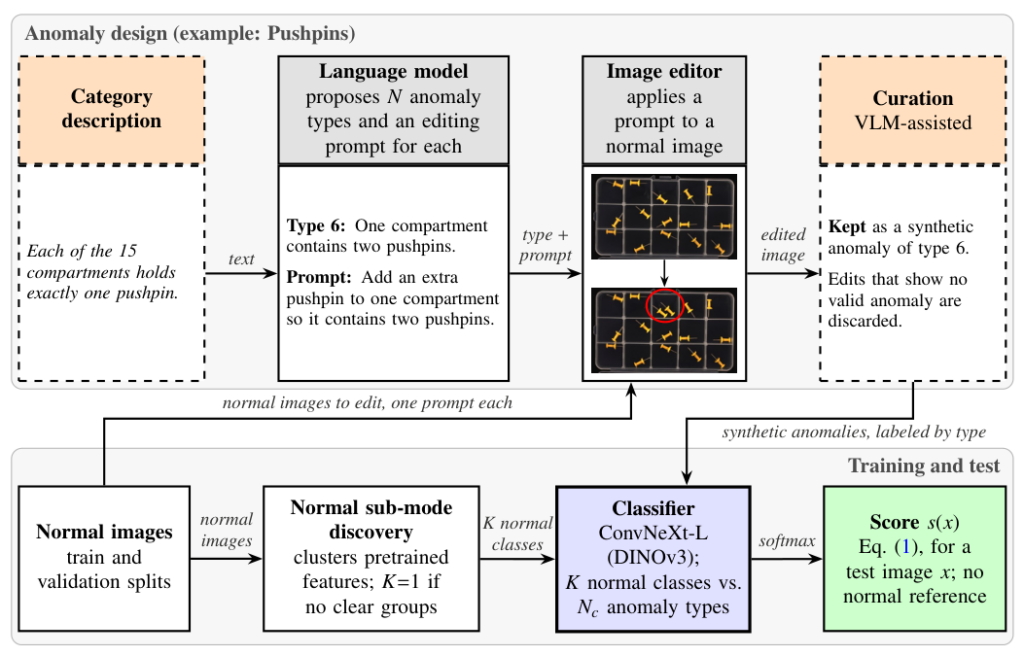
Source: Ufuk Efe, Alptekin Temizel, "Robust Logical Anomaly Detection under Capture Shifts via Synthetic Anomalies", Figure 2. https://arxiv.org/abs/2610.18295 (arXiv non-exclusive license; reproduced unmodified as a quotation). The photos are normal images from MVTec LOCO AD (Pushpins; Bergmann et al., IJCV 2022, CC BY-NC-SA 4.0) and versions of them edited with an image-editing model.
The following diagram is a simplified version of Figure 2.
flowchart TB
  A["Product description"] --> B["LLM generates anomaly types<br/>and editing instructions"]
  B --> C["Image-editing model creates<br/>synthetic anomalies from normal images"]
  C --> D["A person checks with VLM assistance<br/>and keeps only valid edits"]
  N["Normal images"] --> C
  N --> E["Normal images are automatically<br/>grouped into similar clusters"]
  D --> F["Train classifier<br/>normal clusters + anomaly types"]
  E --> F
  F --> G["Sum of non-normal probabilities<br/>= anomaly score"]
  class A,D,E,N neutral
  class B,C core
  class F judge
  class G out
  classDef neutral fill:#F5F5F5,stroke:#757575,stroke-width:1px,color:#1B1B1B
  classDef core fill:#FFCC80,stroke:#BF360C,stroke-width:3px,color:#1B1B1B
  classDef judge fill:#E3F2FD,stroke:#1565C0,stroke-width:2px,color:#1B1B1B
  classDef out fill:#EDE7F6,stroke:#4527A0,stroke-width:1px,color:#1B1B1B
The classifier learns by comparing “evidence of normal” (the normal image before editing) with “evidence of violation” (its edited version). Both were taken under roughly the same capture conditions. The authors therefore reason that darkening or shrinking affects both kinds of evidence in the same way, so the decision is less likely to be pushed toward one side. The authors themselves present this as an untested hypothesis. They also note that generic augmentations kept in training, such as blur and noise, may be contributing.
Results, and what not to read into them
| Method | clean | mixed | drop |
|---|---|---|---|
| CSAD | 97.7 | 68.1 | 29.6 |
| SALAD | 96.4 | 62.3 | 34.1 |
| LogSAD | 89.2 | 73.9 | 15.3 |
| PatchCore | 75.4 | 65.7 | 9.7 |
| Proposed method (full recipe) | 94.9 | 94.1 | 0.8 |
| Proposed method (no overlap) | 93.2 | 92.5 | 0.7 |
Values are image-level AUROC (%) for logical anomalies in MVTec LOCO, averaged over five categories. The comparison methods were re-measured using their published weights, without retraining. The drop is the difference between clean and mixed, calculated by us. For SALAD only, the composition maps published for clean images were used. Because these are not affected by the perturbations, this condition favors SALAD.
The full recipe is the standard configuration, whose training includes brightness and zoom augmentations over the same range as the test perturbations. No overlap is the version with those augmentations removed from training, and it is the one on which the authors base their robustness claim. On clean, the proposed method (full recipe) is 1.5 to 2.8 points below CSAD and SALAD.
Cautions for practical use
First, the perturbations are only two artificial types. Sensor noise from real captures, uneven lighting and object misalignment were not tested. Second, in the mixed test, about 6/7 of the test images are perturbed. This AUROC must not be read as a miss rate or false-alarm rate on a mass-production line. Furthermore, these results come from a single dataset (MVTec LOCO) with a single seed, and structural anomalies are out of scope. The authors themselves state that on a line where capture is strictly controlled, normal-reference methods are the better choice.
If you plan to use this on your own line, beyond the clean ranking, you will want to first check whether the artificial perturbations reproduce the actual range of variation in lighting and position.
The breakdown of the drop also differs by method. CSAD’s drop arises mainly within individual conditions, whereas SALAD’s arises mainly from score offsets between conditions. For example, when only the group of dark images scores high overall, that is an offset between conditions. According to the authors, the latter can be compensated with condition-specific thresholds if the lighting and camera setup are monitored so that the condition can be identified, but the former cannot be fixed this way.
Dependence on a human-written product description also remains an open question in terms of how completely the anomaly types are covered. Inference time, generation cost and human labor are not reported in the paper.
Sources
- Ufuk Efe, Alptekin Temizel, "Robust Logical Anomaly Detection under Capture Shifts via Synthetic Anomalies", arXiv:2610.18295v1 (2026, preprint, not peer-reviewed) https://arxiv.org/abs/2610.18295
- Dataset of the images in Figure 2: Bergmann et al., "Beyond Dents and Scratches: Logical Constraints in Unsupervised Anomaly Detection and Localization", International Journal of Computer Vision (IJCV), 2022. MVTec LOCO AD (https://www.mvtec.com/company/research/datasets/mvtec-loco), license CC BY-NC-SA 4.0. The edited images in the figure were generated by the paper’s authors using an image-editing model (Gemini 3 Pro Image).