
"99% on MVTec AD" Cannot Choose a Method: AUROC of 29 Industrial Anomaly Detection Methods Compared with Their Settings
 kotai2003
When choosing a method for industrial anomaly detection, the first thing many engineers look at is the AUROC value on a benchmark. Yet the leading methods are crowded into the 99% range, and even under the same metric name the measurement settings differ. In this article, we share what became clear while collecting and organising the values of 29 methods from their original papers and from public benchmarks: the four elements to check first when reading an AUROC figure, and how to choose the benchmark setting that corresponds to your own operating conditions.
Note that every figure in this article is a value we collected and organised from each method's original paper and from public unified benchmarks (ADer / IM-IAD / anomalib); none of them is an experimental result we measured ourselves (survey date: September 1, 2026).
The list of 29 methods carried no AUROC values
The GitHub list awesome-industrial-anomaly-detection, widely referred to in surveys of anomaly detection methods, compiles 29 methods as "SOTA methods with code". The table covers method names, papers and links to implementations, but it contains no AUROC scores at all.
In other words, anyone who wants to compare the methods side by side has to go through the 29 original papers one by one. We actually did this, and collected each method's Image-level AUROC (I-AUROC, a metric of how accurately a single image is classified as "normal" or "anomalous") together with its measurement conditions.
What we found along the way is that aligning the conditions under which the numbers were measured is harder than collecting the numbers themselves.
When "99% on MVTec AD" is all you see, you cannot choose any further
First, here are the MVTec AD I-AUROC values self-reported by each method (unsupervised, per-class setting).
| Method | MVTec AD I-AUROC (self-reported, per-class) |
|---|---|
| Dinomaly2 | 99.9 |
| RealNet | 99.65 |
| SimpleNet | 99.6 |
| PatchCore (ensemble) | 99.6 |
| RD++ | 99.44 |
| PatchCore | 99.1 |
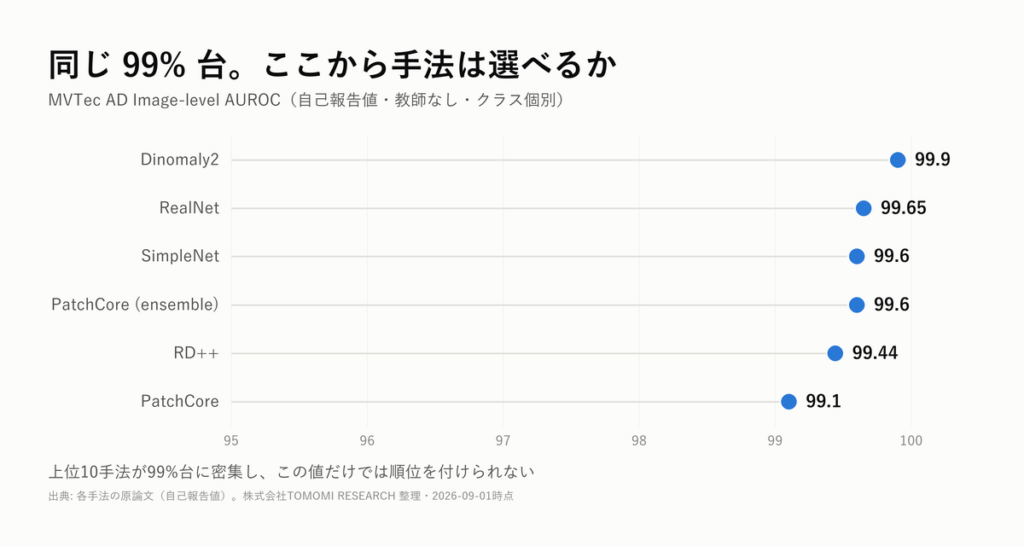
The top 10 methods are crowded into the 99% range. Within this range, there is no way to tell whether a difference of 0.1 to 0.5 points reflects a real difference in capability or fluctuation from implementation details and random seeds. Ranking methods by their MVTec AD values alone has no meaningful basis.
The same "I-AUROC" covers six different measurement conditions
What makes it more troublesome is that numbers carrying the same name, "MVTec AD I-AUROC", are in fact obtained under different measurement settings. There are six main ones.
- Per-class — one model is trained for each product type (the most common self-reported setting)
- Multi-class unified — one model handles all product types
- Few-shot — only 1 to 16 normal images are used
- Zero-shot — no training images of the target product type are used
- Noisy — assumes anomalous images are mixed into the training data
- Supervised — anomaly labels are used in training
The metric name is the same, but the problems being solved are different. An AUROC value must always be read together with its setting.
Align the conditions, and the picture changes
Here are values from public benchmarks that re-evaluated the methods with a unified implementation (such as ADer), placed alongside the self-reported values. The important point is that a method whose value drops is not a "weak method"; rather, the conditions the method was designed for do not match the evaluation setting. Many methods are designed on the premise of per-class training, and placing them in a multi-class unified setting changes that premise.
| Method | Self-reported (per-class) | ADer (multi-class unified) |
|---|---|---|
| PatchCore | 99.1 | 98.8 |
| RD4AD | 98.5 | 93.6 |
| SimpleNet | 99.6 | 95.4 |
| RealNet | 99.65 | 84.8 |
| DRAEM | 98.0 | 54.5 |
| CFA | — | 57.6 |
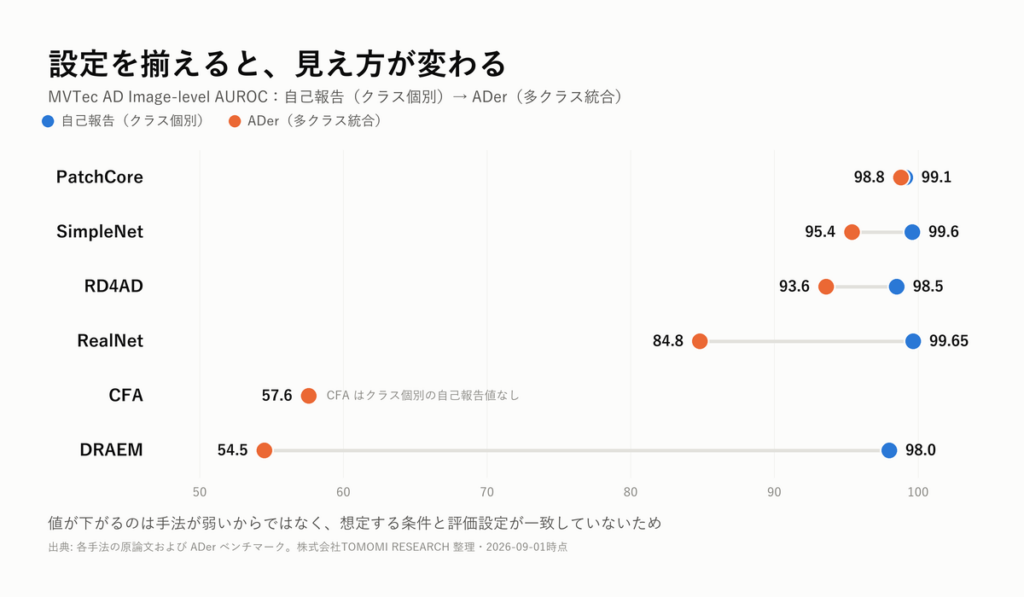
PatchCore is stable on other benchmarks as well, holding close levels of IM-IAD 99.2 / anomalib 98.0. RD4AD also stays at a high level while swinging between benchmarks, at 93.6 / 98.6 / 98.5.
Meanwhile, the top of the multi-class unified setting is occupied by methods that are not in the SOTA table mentioned at the start: InvAD 98.9 / PatchCore 98.8 / MambaAD 98.5 / ViTAD 98.4. On the more demanding Real-IAD, the gap widens, with InvAD at 89.4 against SimpleNet 54.9 and DRAEM 50.9.
Saying "MVTec AD is saturated" also holds only within the group of the latest methods. On anomalib (seed=42 fixed), the values span 0.58, from Dinomaly 0.997 down to GANomaly 0.421.
Rankings change from setting to setting
Change the setting, and the rankings themselves change.
- In the average of the five IM-IAD settings, PatchCore ranks first at 0.938
- In the continual learning setting (assuming product types are added one after another), PatchCore scores 0.919, against RD4AD 0.596 and CFA 0.623
- In the 8-shot setting, the order is different again
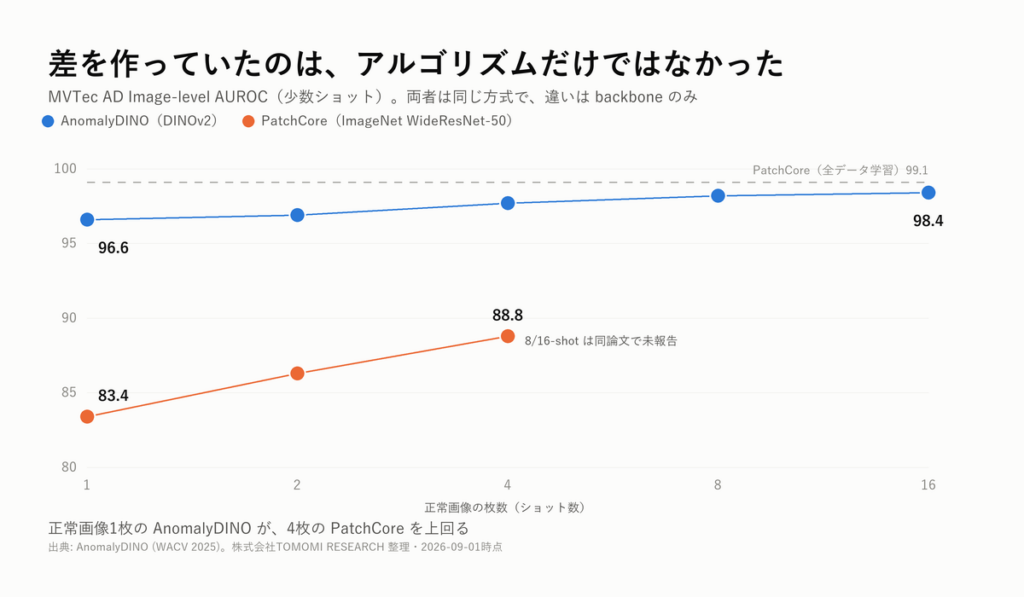
Even with the same group of methods, results move this much simply by changing the evaluation setting. Put the other way round, choosing the benchmark whose setting is closest to your own operating conditions greatly improves the accuracy of your selection.
The difference did not come from the algorithm alone
Another factor easily overlooked in method selection is the contribution of the backbone (the pre-trained model used for feature extraction).
AnomalyDINO and PatchCore use the same approach, storing normal features in a memory bank and judging by distance; the only difference is the backbone (PatchCore uses WideResNet-50 trained on ImageNet, AnomalyDINO uses DINOv2). Compared in the few-shot setting, the difference is clear.
| Setting | AnomalyDINO | PatchCore |
|---|---|---|
| 1-shot | 96.6 | 83.4 |
| 4-shot | 97.7 | 88.8 |
| Variation | ±0.4 | ±3.0 |
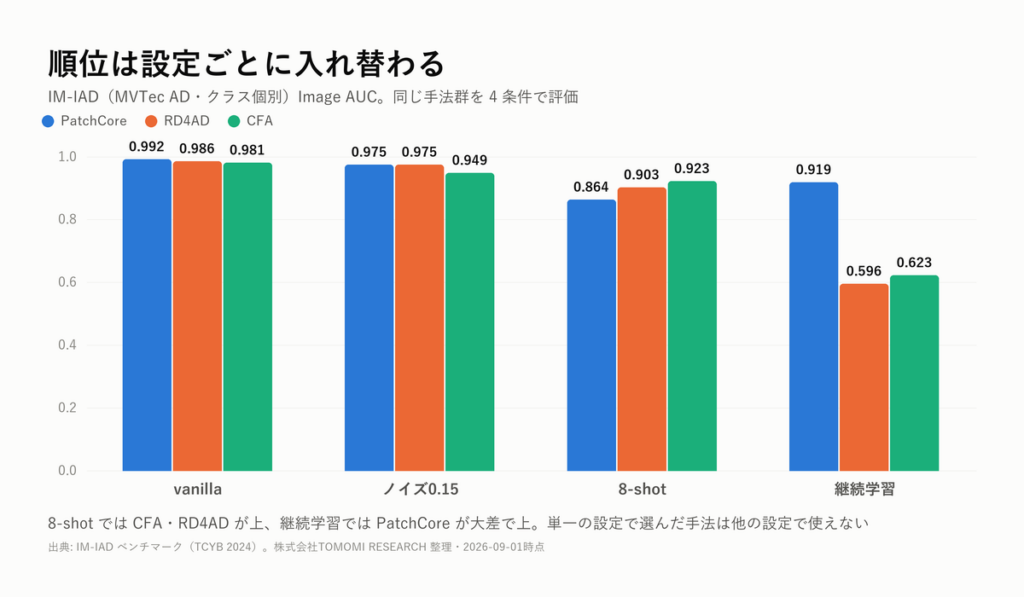
AnomalyDINO reaches 98.4 at 16-shot, coming within 0.7 points of the 99.1 achieved by PatchCore trained on the full data. Where the full data is available, however, PatchCore remains strong, and in the batch zero-shot setting it does not reach the 97.8 of MuSc.
This difference comes not from an improved algorithm but from the quality of the visual features held by the backbone. It is a factor that stays invisible as long as you compare by method name alone.
Six guidelines for choosing from your own conditions
Based on the above, here is how operating conditions map to the benchmark settings and methods to refer to.
| Your operating condition | Indicative method |
|---|---|
| You want one method that runs reliably | PatchCore |
| Multi-class unified (one model for all product types) | InvAD / Dinomaly family |
| Noise is mixed into the training data | PatchCore (MVTec family) / RD4AD (MPDD family) |
| Product types keep increasing (continual learning) | PatchCore (other methods drop to 0.31 to 0.62) |
| Logical anomalies (missing parts, wrong counts) | GCAD / SALAD family (PatchCore and RD4AD rank low at 0.69) |
| Few-shot (around 8 images) | RD4AD / CFA |
Decide four things first: the number of product types on your line, how often new types are added, how clean your training data is, and the kinds of anomaly you want to detect. Once these are fixed, the benchmark setting to refer to follows naturally.
We have published a comparison of 29 methods with their settings
We have published the results of this survey as a dedicated page, "Anomaly detection SOTA and AUROC compared". It is structured as follows.
- The problem
- Comparison by re-implementation under unified conditions
- Four elements for reading AUROC (setting, backbone, dataset, metric)
- A selection tool that recommends a benchmark once you enter your floor's conditions
- A detailed list of the 29 methods with their settings
- New areas after MVTec AD saturation (3D, logical anomalies)
Of the 29 methods, two, SAA/SAA+ and AD-Copilot, do not report Image-level AUROC, so the corresponding fields in the list are left blank.
Summary
When you look at a benchmark value, the first things to check are the four elements of setting, backbone, dataset and metric. A number whose four elements do not match your own operating conditions cannot serve as a basis for comparison as it stands. Conversely, a comparison with aligned conditions becomes a solid basis for selecting a method.
The comparison of 29 methods with their settings, and the selection tool that recommends a benchmark from your operating conditions, are available on the dedicated page.
→ https://www.tomomi-research.com/en/ad-sota
If you would like advice on which benchmark setting to refer to for the conditions of your own line, please feel free to contact us at TOMOMI RESEARCH, Inc.

