Same TR-100, Only the Lens Switched to High Magnification: Observing a Semiconductor Chip
 kotai2003
What decides how something looks in inspection is often not the performance of the equipment itself but the design of the conditions: "which lens, and which field of view, to capture it with". This time we fitted a high-magnification lens to the AI visual inspection system TR-100 and captured a sample semiconductor chip. The equipment and the type of subject are the same as last time (June 16, 2026); the only thing we changed was the lens.
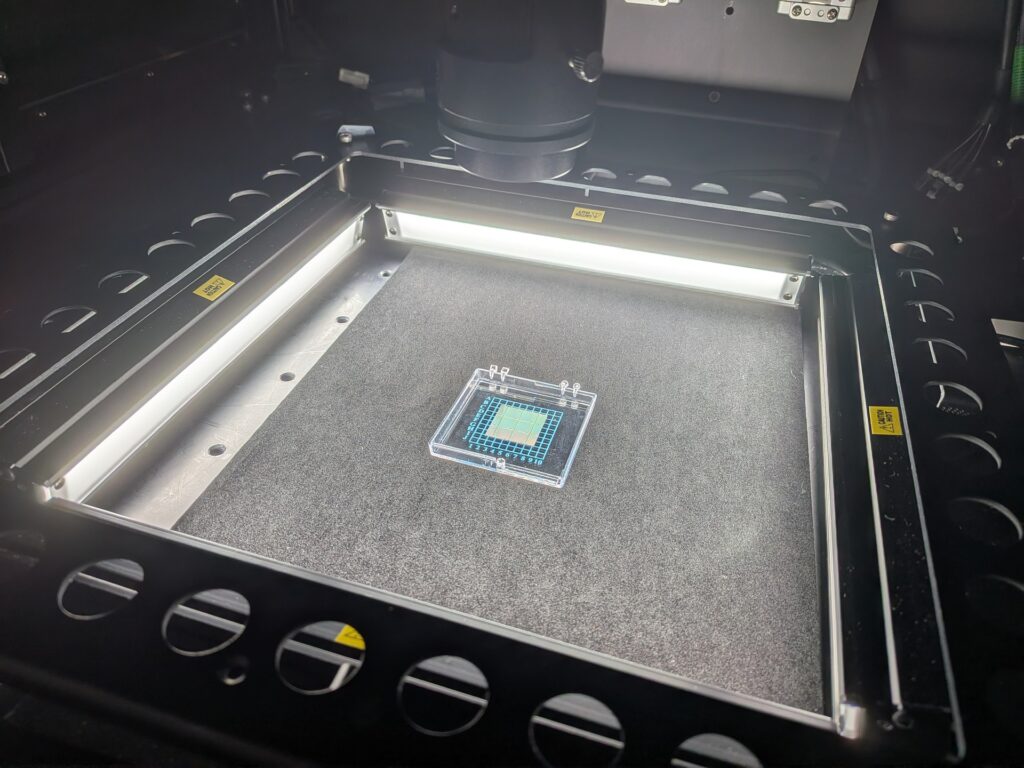
Inside the inspection system: a single semiconductor chip in a transparent case printed with a grid scale and alphanumeric index sits on a black stage, two bar lights at the front and back are lit, and above them a camera and a black cylindrical lens barrel point downwards
The chip is a small square with a pale green to gold sheen, positioned at the centre of the grid on the case. The lens barrel above is this time's high-magnification lens.
What do you gain in exchange for a narrower field of view?
Choosing a lens is a trade-off between field of view and resolution. Higher magnification narrows the area captured at once, but in return reduces the real-world size each pixel covers. Fine structures that a standard lens could only record as "pattern" become captured as "shape" with defined outlines. That was the aim this time.
In other words, choosing a lens is the same as "choosing what to see".
First, as it looks: the high-magnification LIVE image
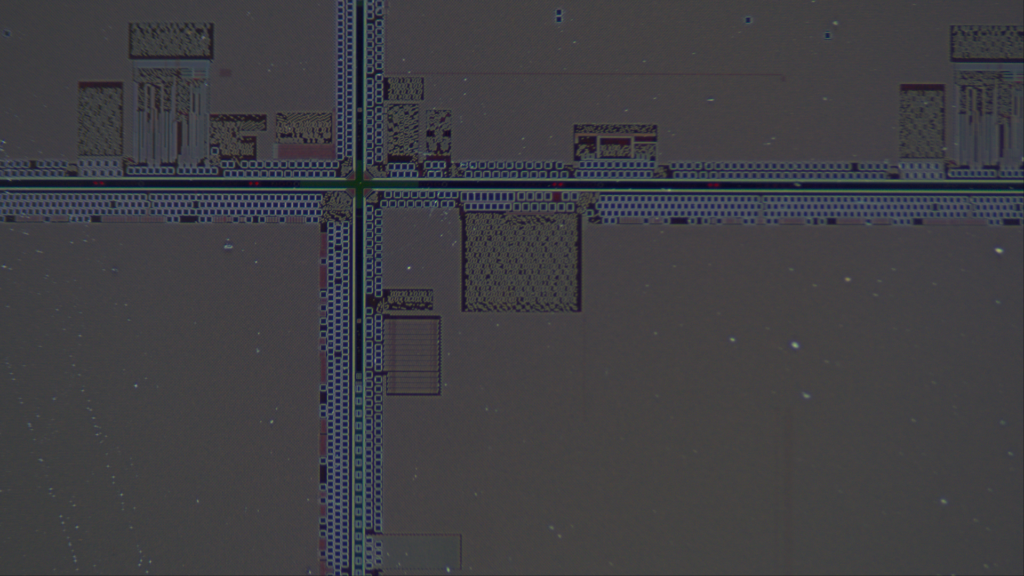
Full-colour LIVE image of the semiconductor chip surface. A grey to reddish-purple metallic surface is divided into four sections by one vertical and one horizontal straight line crossing like a cross, with a thin green to yellow-green bright line and tiny red dots shining along the centre of the lines. Along both sides of the lines run bands of small squares at regular intervals, and in the upper half and centre there are rectangular blocks filled with checkerboard and mesh patterns and comb-like patterns of vertical stripes. The wide surfaces inside the sections are plain grey, with fine white and pale blue bright spots scattered across them
You can make out the cross of straight lines corresponding to the dicing streets (scribe lines), the bands of squares lined up at regular intervals on either side, the checkerboard blocks and the comb-like patterns. At this stage, however, colour and shading remain mixed. From this image alone, you cannot tell whether the scattered bright spots are deposits or changes in colour.
Remove the colour, and flatness and texture become clear at the same time
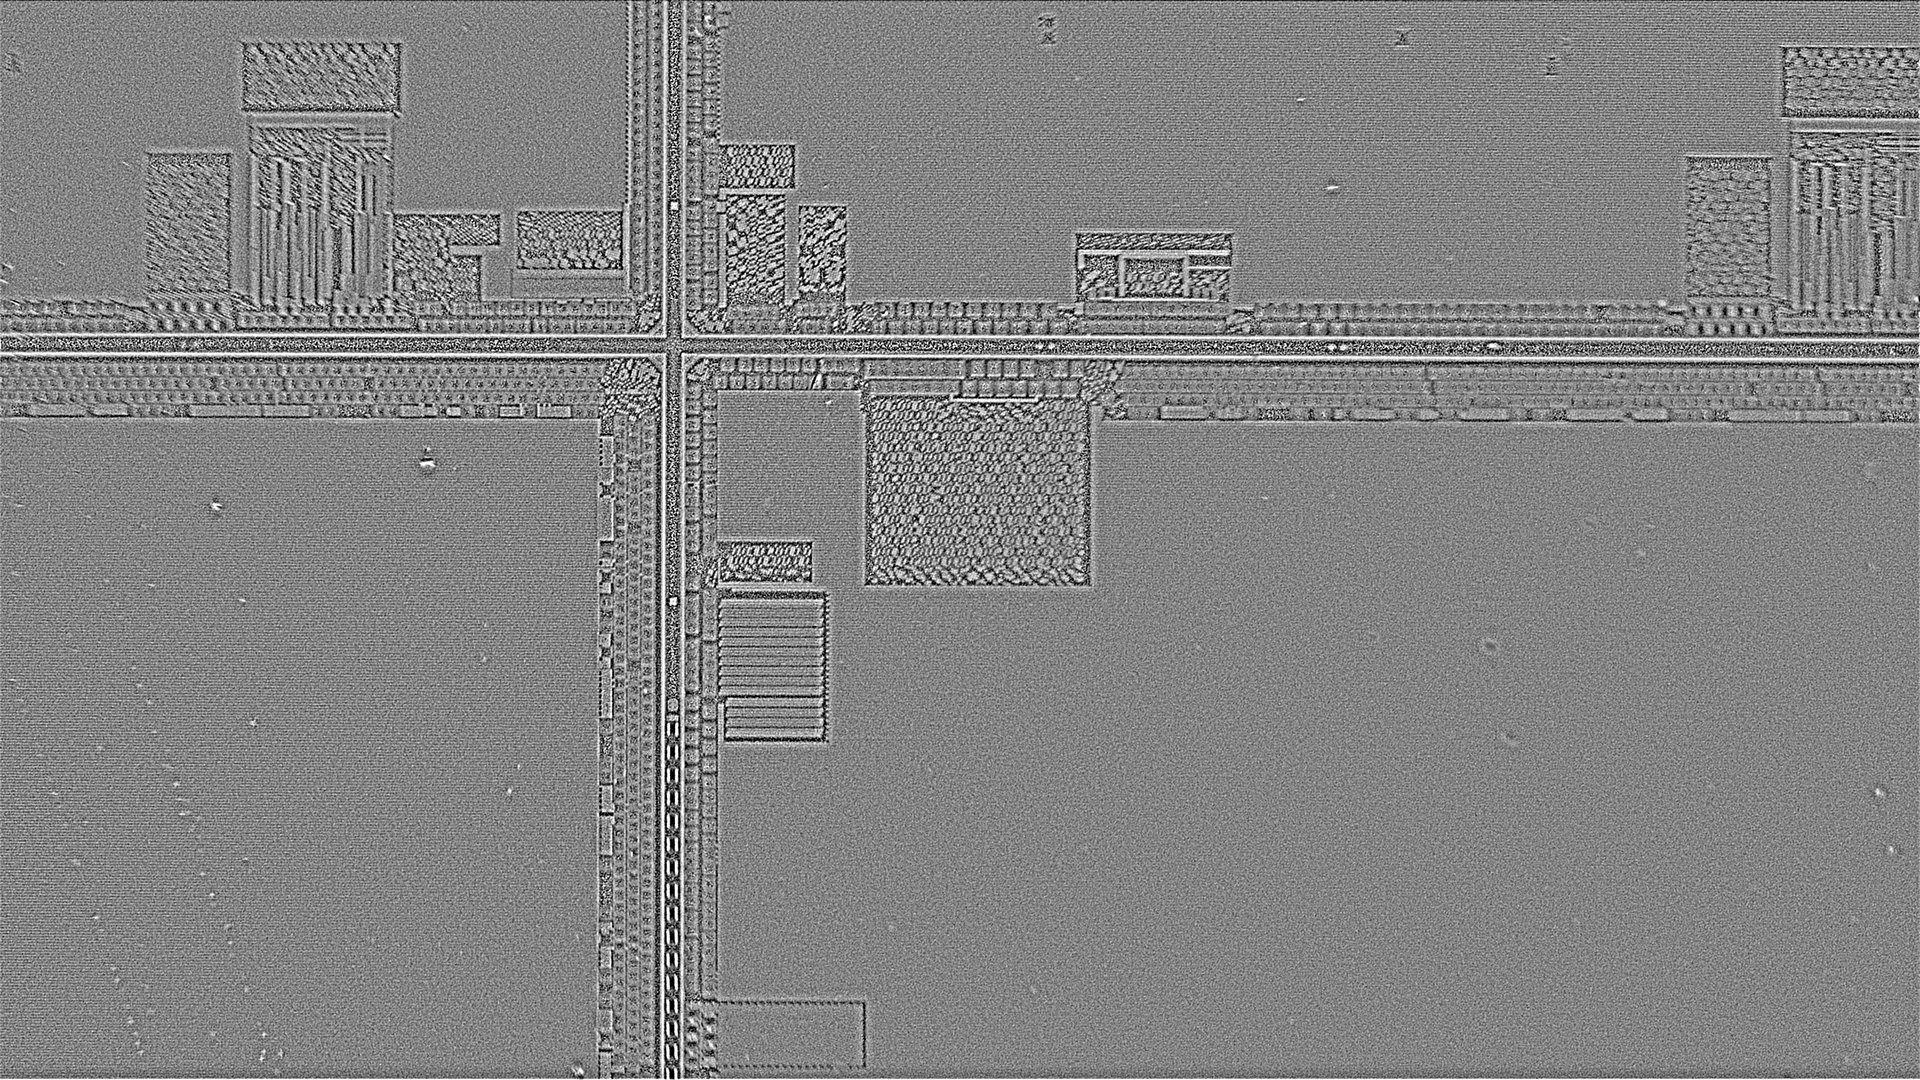
Take the colour away and the situation reverses. The wide surfaces remain flat grey, confirming that they are actually flat rather than just uneven in colour. Edges and steps, on the other hand, rise as relief, and the grains of the checkerboard blocks and each tooth of the comb, which were crushed together in the LIVE image, appear separated as individual elements. The area of fine horizontal stripes that was hard to see in the LIVE image also becomes clearly defined as shape here.
Some of the scattered bright spots remain as small grains in this output too. They appear not as colour deposits but as shape as well, which means they can be read as tiny protrusions that actually have height.
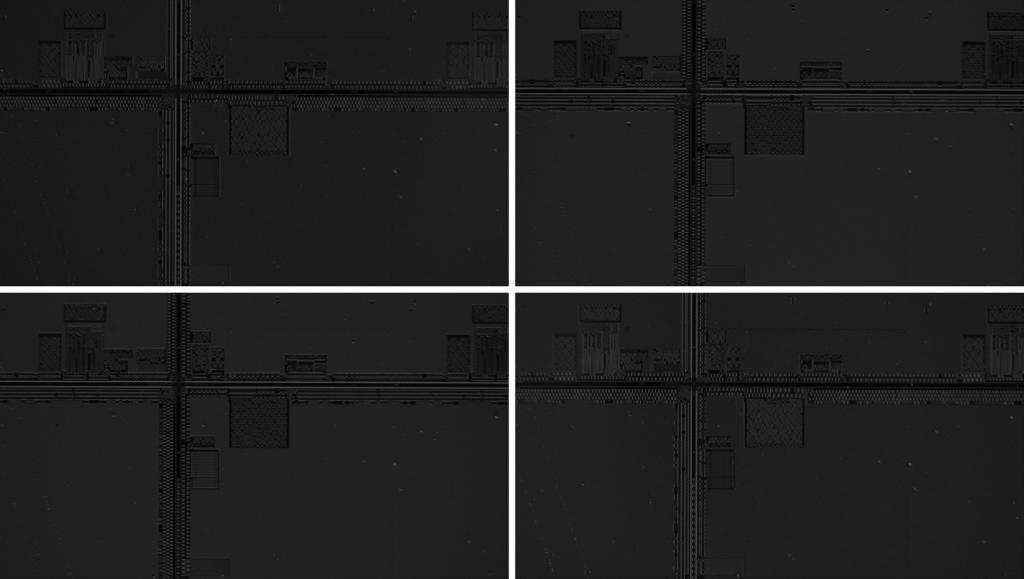
*The source images captured under lighting from four directions, arranged in a 2 × 2 grid. Four images of the same field of view lit from different directions, each with different shading
What supports this separation is FORESIGHT STEREO® (our 3D imaging technology, developed in-house from Photometric Stereo). The input is a single capture, and colour and shape are reconstructed simultaneously from the set of images taken under lighting from four directions. No recapture is needed.
Seeing by the "direction" of the surface: Surface Normal

Surface Normal output. Almost the entire image is filled with a single deep blue, within which only the outlines of the cross of lines, the rows of squares, the checkerboard blocks and the comb-like patterns stand out in relief as subtle differences in the shade and hue of blue
Surface Normal is an output that encodes the direction of the surface at each point as colour (the colour itself has no meaning). Where the directions are aligned, the colour is the same; where the surface tilts, the colour changes. Almost the entire surface being a single deep blue means that most of it is flat and facing the camera. Only the places with structure stand out as faint relief.
Switching how height is "displayed"
Even with the same 3D Surface, changing how height is displayed changes the kind of information you can read. Note that all of the following show relative height, not absolute values.
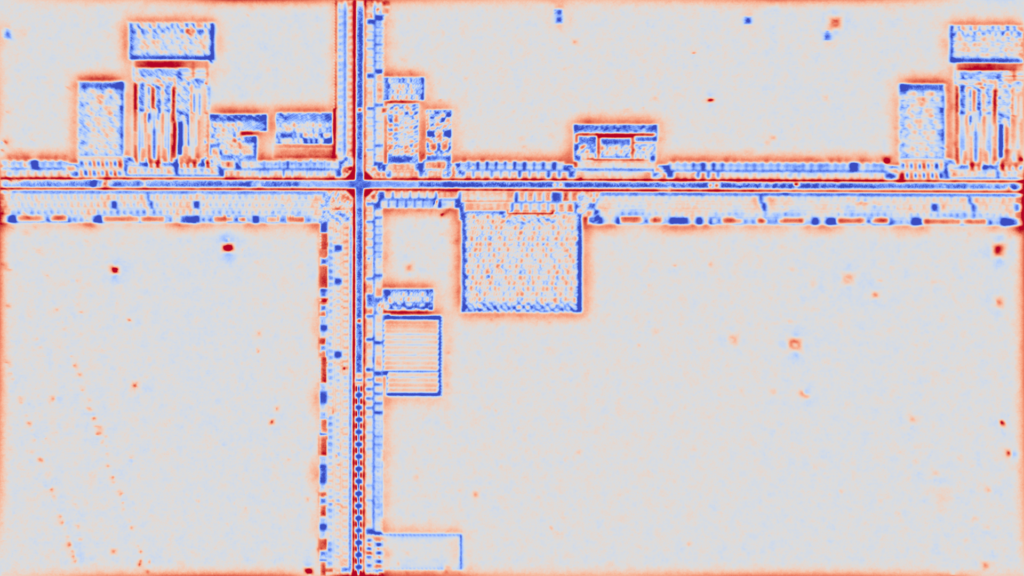
Enhanced + colour map display. With a two-colour blue / white / red (orange) colour map, the cross of lines and the rows of squares stand out as distinct blue bands, and orange to red borders appear around the edges of the blocks and the rims of steps. Inside the checkerboard blocks, blue and orange are finely intermixed, and small orange and red dots are scattered across the pale colour of the wide flat surfaces
In the colour map, the cross of lines and the rows of squares stand out as blue bands. You can see at a glance that they are groove-like structures lower than their surroundings. Orange to red borders appear at the rims of steps, so you can also read by colour which side of a boundary is higher. And the small orange and red dots scattered across the wide flat surfaces, tiny protrusions higher than their surroundings, are made conspicuous by colour. The key point of this display is that it makes searching for foreign matter intuitive.
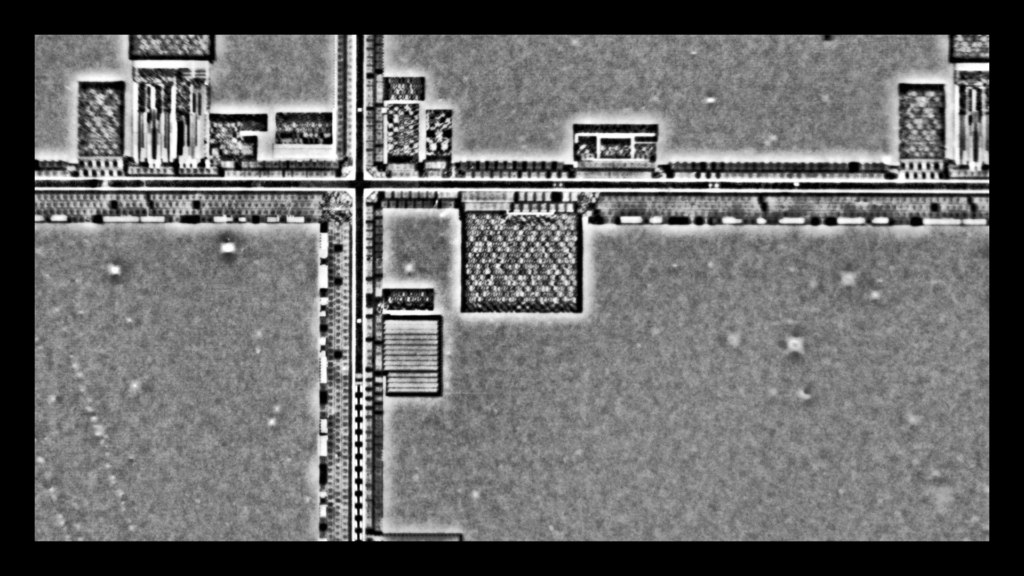
Enhanced + band display. A monochrome image with a black frame, in which height is quantised into contour-like bands; flat surfaces become uniform grey areas and structures separate into distinct white and black tones. The checkerboard blocks, comb-like patterns and rows of squares have sharp outlines and are easy to read as patterns, and on the wide flat surfaces several faint, blurry white dots and small cross-shaped glints are visible
The band display quantises height into steps. The outlines of structures become sharper and easier to read as patterns, while faint, blurry white dots and small cross-shaped glints appear on the wide flat surfaces. Slight undulations and deposits that are hard to notice in the LIVE image have been brought out by the stepped display. It is suited to capturing the distribution of waviness and tiny height differences across the whole surface.
How does this help on the inspection floor?
In inspecting highly reflective and glossy materials, separating "colour unevenness from shape defects" is often the point of contention. If colour and shape can be output separately, this judgement becomes easier to handle, whether by eye or by automatic judgement. Being able to confirm, as here, that wide surfaces are actually flat, and conversely to pick up as shape the tiny protrusions that were hidden in colour: that is the practical benefit of separation.
The size of the defects you want to catch, and the area you want to see at once: this comparison should serve as a reference for the design approach of working backwards from these two to decide the lens and the field of view.
Summary
- Without changing the equipment, changing the lens changes what you can see. A high-magnification lens narrows the field of view but in return makes it possible to capture as shape the fine structures that were lost in the pattern.
- Colour and shape are information to be viewed separately, and the higher the magnification, the more the separation pays off. FORESIGHT STEREO® separates and outputs both from a single capture.
- You can also choose how height is displayed. The colour map suits an intuitive grasp of "where it is high or low", and the band display suits grasping undulation across the whole surface.
This article is an observation demo on a single sample and does not guarantee general detection performance. Actual appearance varies with the material and surface condition of the workpiece and the defect size required.
If you would like to check how your own workpieces look with which lens and which field of view, please contact TOMOMI RESEARCH, Inc. We also carry out capture tests on samples you send us.