
How Much Do Field of View and Resolution Change with Focal Length? Measured Comparison of 35 / 50 / 85 mm Line Scan Lenses
 kotai2003
"Widen the field of view and resolution drops." Anyone involved in visual inspection knows this principle. But when it comes to actually choosing a lens, what matters is not the principle itself but the number: "so how much does it drop?"
First, take a look at one image. We fitted three industrial line scan lenses with different focal lengths (35 mm / 50 mm / 85 mm) in turn to the AI visual inspection system TR-300, captured the same object, and arranged the results at the same scale.
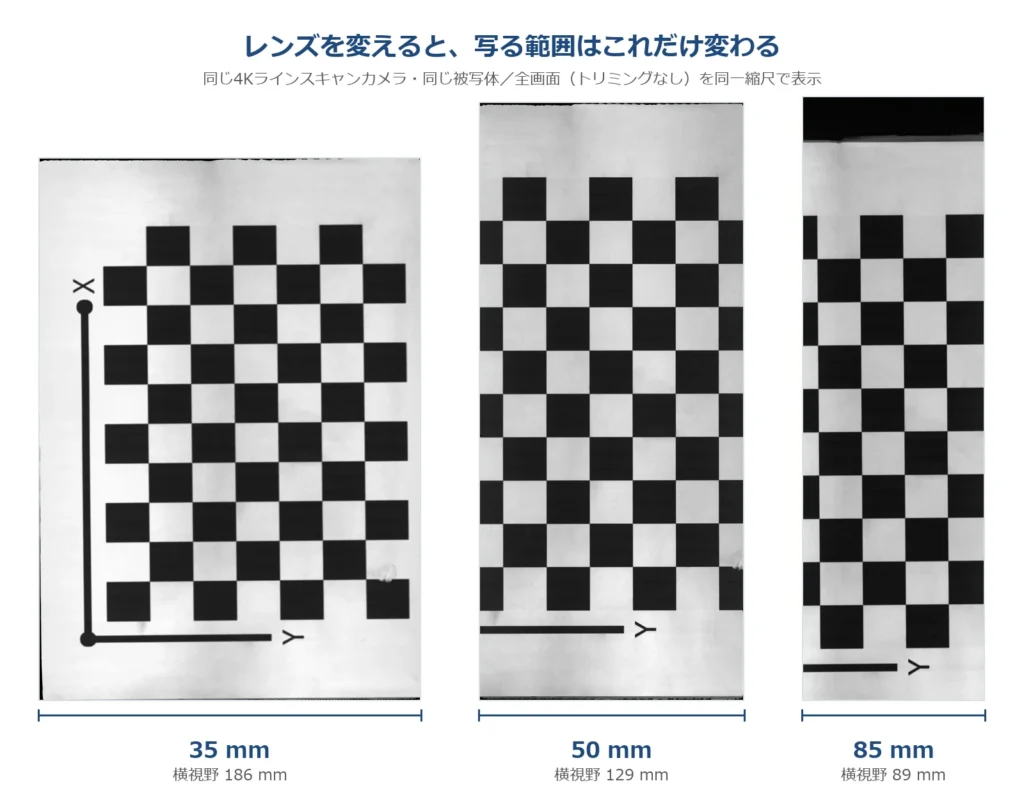
Full frames of the same object captured with 35 mm, 50 mm and 85 mm industrial line scan lenses, arranged at the same scale. The longer the focal length, the narrower the width that fits in the frame
The difference in width between the three images is the difference in field of view. At 35 mm a wide area fits in at once; at 85 mm the same object appears larger, but more of it extends beyond the frame. It looks like an obvious picture, but on the floor this "part that extends beyond the frame" translates directly into the number of passes and the takt time.
This time, rather than relying on catalogue specification tables, we captured the three lenses side by side on actual equipment and measured field of view, resolution and brightness. We publish everything from the measurement method to the values in a form you can use directly when studying your own inspection conditions.
1. How we measured: working back from a checkerboard with 21 mm squares
Catalogue field-of-view values assume a specified working distance and sensor size. The most reliable way to know the field of view once a lens is mounted on actual equipment is to measure it yourself. We placed a checkerboard with 21 mm squares, captured it, and worked back from that.
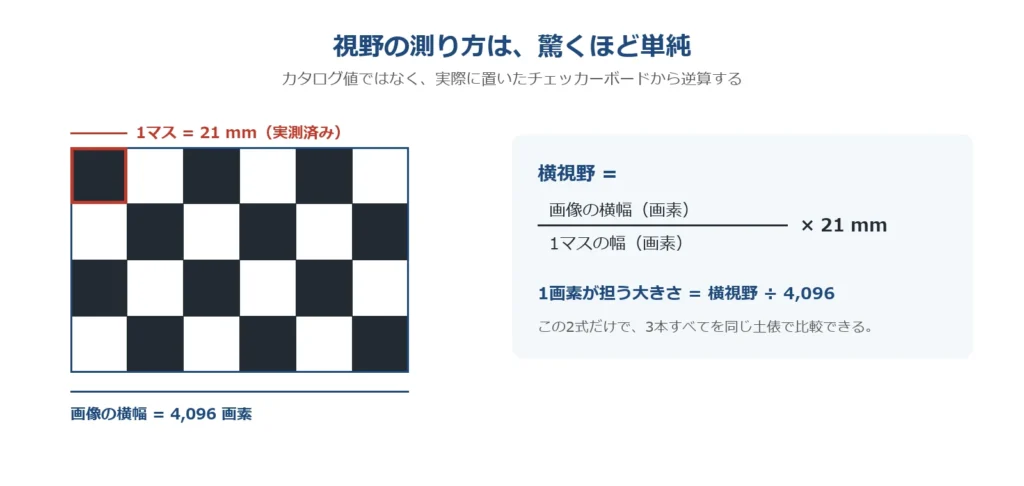
Diagram, with formulas, of the procedure for working back the horizontal field of view and the size covered by one pixel from an image of a checkerboard with 21 mm squares
Only two formulas are used.
- Horizontal field of view = (image width in pixels ÷ pixels per checker square) × 21 mm
- Size covered by one pixel = horizontal field of view ÷ 4,096 pixels
The camera is a 4K line scan camera (4,096 pixels, 7 µm pixel pitch). With these two formulas and one checkerboard, the three lenses of different focal lengths can be put on exactly the same footing. The diagram shows the whole flow in one line, from counting how many pixels one checker square occupies to the final µm/pixel. No special measuring instrument is needed.
2. Measured field of view and resolution: putting the trade-off into numbers
Here are the measured results for the three lenses.
| Lens | Horizontal field of view | Size covered by one pixel | Resolution relative to 35 mm |
|---|---|---|---|
| 35 mm | 186 mm | 45.4 µm/pixel | 1.00× |
| 50 mm | 129 mm | 31.5 µm/pixel | 1.44× |
| 85 mm | 89 mm | 21.7 µm/pixel | 2.09× |
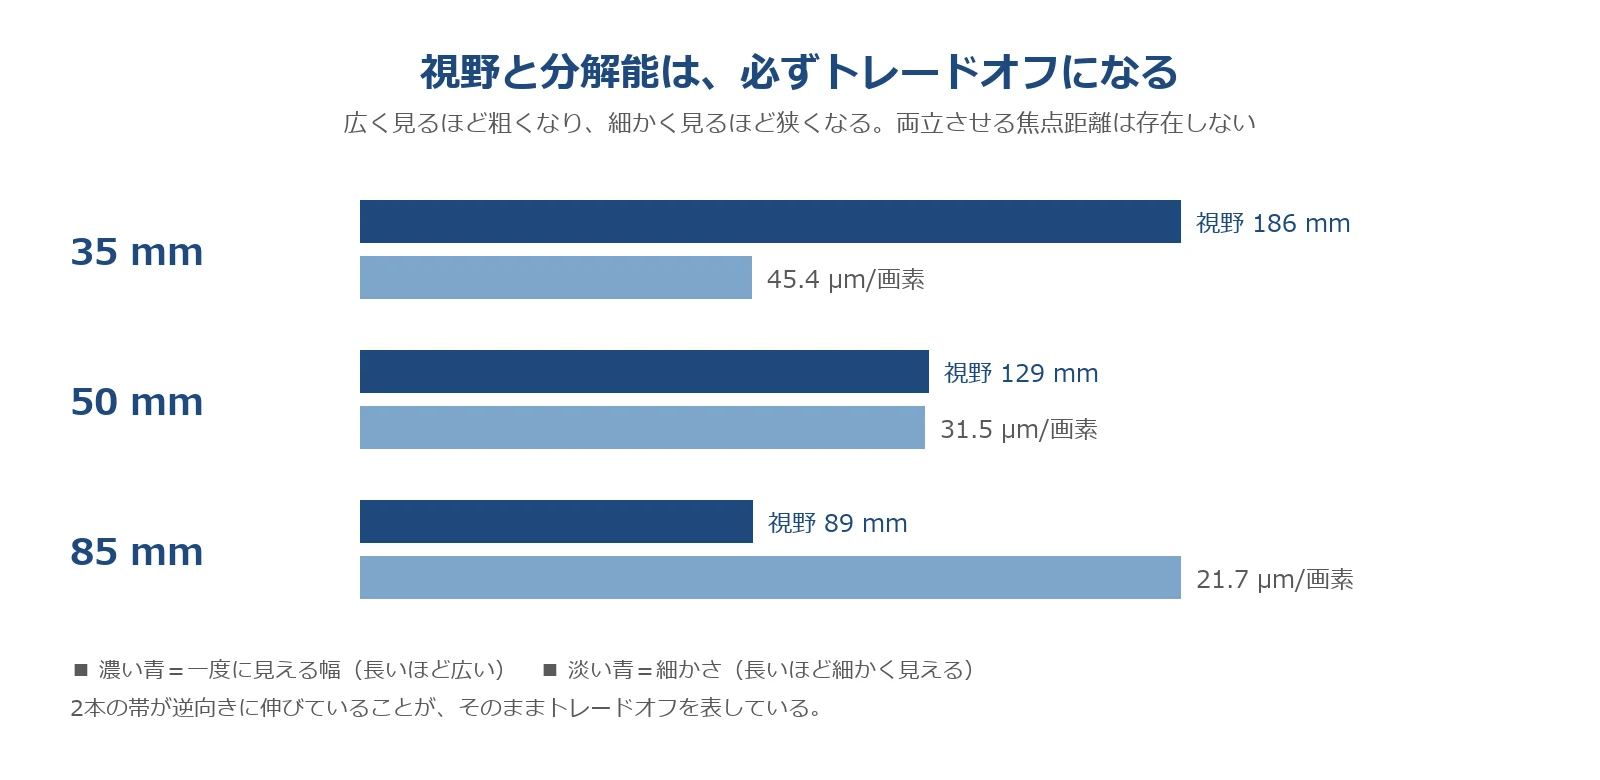
The two sets of bars in the graph point neatly in opposite directions. Switching from 35 mm to 85 mm, the field of view narrows by more than half, from 186 mm to 89 mm, and in return resolution increases 2.09 times. 50 mm sits right in the middle, with a field of view of 129 mm and 31.5 µm/pixel.
What should be kept in mind here is that there is no exception to this relationship. "A focal length with both a wide field of view and high resolution" does not exist. Things move faster if you think of choosing a lens as deciding where on this line to place your inspection.
3. How does the appearance change? Cropping the same 60 × 60 mm and placing them side by side
Numbers alone are hard to grasp, so we cropped the same 60 × 60 mm area from the three images and displayed them at the same size.
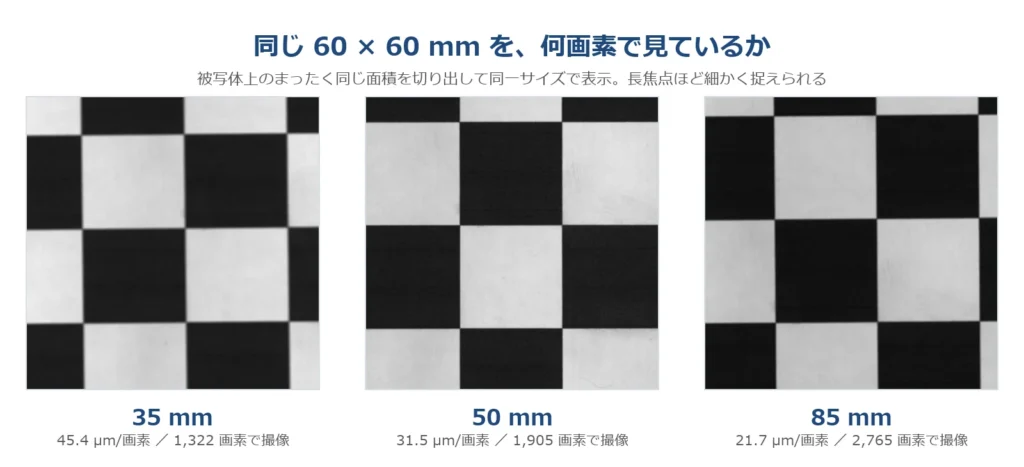
The same 60 × 60 mm area cropped from each of the 35 mm, 50 mm and 85 mm images and arranged at the same size. The longer the focal length, the more pixels render the same area and the more smoothly fine detail is preserved
The same area is drawn with few pixels at 35 mm and with many pixels at 85 mm. The difference shows in the smoothness of outlines and how well fine patterns survive. Detail that remains as shape at 85 mm is buried in coarse pixels and flattened at 35 mm. This is what "2.09 times the resolution" looks like.
Conversely, if a difference of this size is enough, there is no reason to sacrifice field of view. Decide the resolution you need first, then choose the focal length with the widest field of view that still meets it. On the floor, that is the order least likely to go wrong.
4. How many pixels is "a 10 µm scratch"?
Whenever inspection specifications come up, the request "we want to see 10 µm scratches" always follows. Converted into pixels, it looks like this.
| Scratch width | 35 mm | 50 mm | 85 mm |
|---|---|---|---|
| 10 µm | 0.22 pixels | 0.32 pixels | 0.46 pixels |
| 20 µm | 0.44 pixels | 0.63 pixels | 0.92 pixels |
| 30 µm | 0.66 pixels | 0.95 pixels | 1.38 pixels |
| 50 µm | 1.10 pixels | 1.59 pixels | 2.30 pixels |
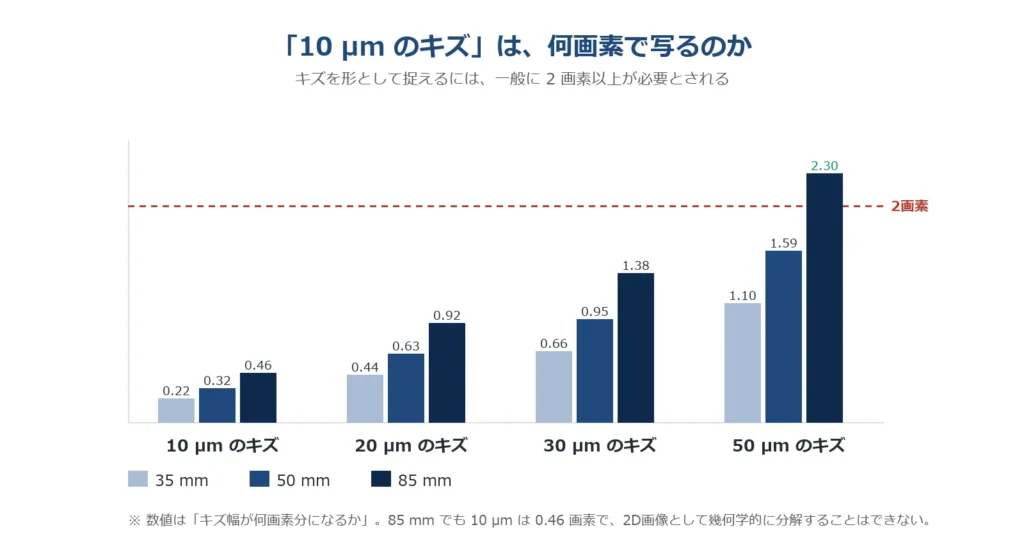
Graph showing how many pixels scratches of 10 µm, 20 µm, 30 µm and 50 µm correspond to with each of the 35 mm, 50 mm and 85 mm lenses. A line is drawn at 2 pixels, the guideline for capturing a scratch reliably as shape
In general, capturing a scratch reliably as shape requires 2 pixels or more as a guideline. The only case above the 2-pixel line in the graph is the 50 µm scratch viewed at 85 mm (2.30 pixels).
Working back the scratch width that corresponds to 2 pixels gives 35 mm: about 91 µm / 50 mm: about 63 µm / 85 mm: about 43 µm. In other words, with this configuration, whichever lens you choose, "resolving a 10 µm scratch as an image" is not possible. This is not a failure but the most important check for matching the required specification against the optical conditions. (However, "cannot be resolved" does not mean "cannot be detected". We come back to this in Section 8.)
5. The often-overlooked second axis: brightness
Lens selection often ends up as a discussion of resolution alone. In practice, however, a second axis, brightness (f-number), decides whether the inspection works at all.
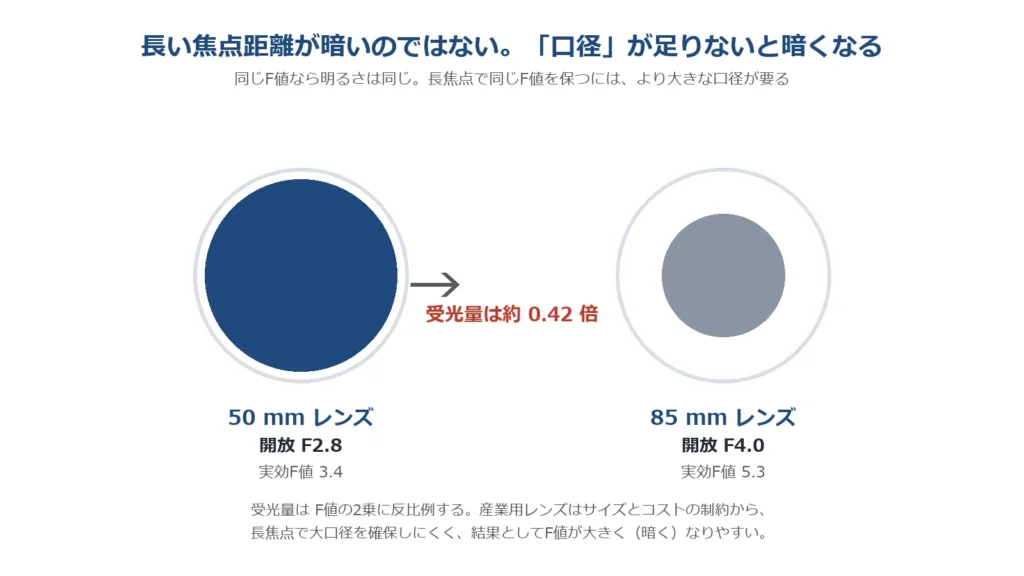
Diagram comparing the effective aperture and amount of light received for lenses with a maximum aperture of f/2.8 and f/4.0. It shows that the larger the f-number, the smaller the aperture and the less light can be taken in
Of the three lenses this time, the 85 mm had a maximum aperture of f/4.0, and the 35 mm and 50 mm had f/2.8. Taking the imaging magnification into account, the effective f-numbers are 3.2 / 3.4 / 5.3. In theory, the 85 mm receives only about 0.42 times the light of the 50 mm. In the actual images too, the 85 mm was the darkest, with white-area luminance of 226 → 209 → 194 (35 mm → 50 mm → 85 mm).
It is important not to confuse cause and effect here. It is not that "a longer focal length makes it darker". At the same f-number, brightness is the same. But keeping the same f-number at a longer focal length requires a correspondingly larger effective aperture. Industrial lenses find it hard to secure that aperture because of size and cost constraints, and as a result the f-number tends to become larger (darker). That is the order of things.
Being darker is something that can be dealt with in itself. But the remedy is a choice between two: lengthen the exposure time (the line speed drops) or raise the gain (noise increases). TR-300's core technology, FORESIGHT STEREO (Photometric Stereo: a method that finds the tilt of the surface, the normal, from images captured with light from several directions), relies on tiny differences in brightness, so a drop in S/N (signal-to-noise ratio) directly affects accuracy. Going after resolution can end up lowering the line speed, or noise can roughen the normals: only when all of this is included can a lens choice be judged.
6. What we know, and what is not yet confirmed
As a technical note, we draw a line here.
What we know. The field of view, the size covered by one pixel and the pixel conversion of scratches have been confirmed by measurement. The values in §2 and §4 can be used directly in your studies.
What is not yet confirmed. The quantitative comparison of brightness. The measured luminance drop was about 0.86 times relative to 35 mm (226 → 194), whereas the theoretical value calculated from the effective f-numbers is about 0.38 times. The measured drop was considerably smaller than theory. We think it is highly likely that part of it was compensated by gain or lighting at capture. Confirming this quantitatively requires recapturing with aperture, exposure, gain and lighting fully matched.
So what can be said at present is only the order, "the 85 mm was the darkest"; "how many times darker" must wait for a remeasurement under matched conditions. The trend is consistent, so it can be used for qualitative judgement, but not as a quantitative design value: please understand that this is information of that level of precision. Talking about ratios without matching the measurement conditions shifts every design decision that follows.
7. So how do you choose?
In this evaluation, we concluded that 50 mm offers the best balance. It secures a 129 mm field of view at 31.5 µm/pixel, and its effective f-number of 3.4 is almost on a par with the 35 mm (3.2). What counted was that resolution could be raised 1.44 times with hardly any loss of brightness.
On that basis, in practice we think a two-lens configuration, using 35 mm as a wide field-of-view mode and 50 mm as a high-resolution mode, is a realistic approach. Rather than trying to meet every inspection requirement with one lens, changing where field of view and resolution are set for each target turns out to be more stable. Note that this is a conclusion drawn from this evaluation and has not been decided as a product specification.
8. "Can be detected" and "can be resolved" are separate questions
Finally, a word on the caveat we placed in Section 4.
"Detecting a 10 µm scratch" and "resolving 10 µm as an image" are separate questions. Resolving means correctly reproducing the shape and width of the scratch in the image. Detection, on the other hand, is achieved if it can be judged that "there is an anomaly there".
Photometric Stereo relies not on brightness itself but on the tilt of the surface (normal) and its changes. So even if a scratch is narrower than one pixel, it may appear as a change in that pixel's normal and gradient that differs from the surroundings, and be captured as an anomaly. A scratch that fits within one pixel changes how that pixel looks.
This does not, however, mean "it can always be detected". Success depends on the depth of the scratch, the material of the surface and the lighting conditions. The 2-pixel limits (35 mm: about 91 µm / 50 mm: about 63 µm / 85 mm: about 43 µm) are strictly limits on "whether the shape can be resolved", and do not coincide with limits on "whether it can be detected". Keeping these apart is the starting point for building inspection specifications realistically.
Summary
- Field of view and resolution are always a trade-off. From 35 mm to 85 mm, the field of view narrows from 186 mm to 89 mm, and resolution increases 2.09 times accordingly. No focal length achieves both.
- Choosing by resolution alone leads to failure. Judge with brightness (f-number) → S/N → line speed included. Keeping the same f-number at a long focal length requires a large aperture, which is hard to secure in industrial lenses, so they tend to end up darker.
- "Detecting" and "resolving" are separate questions. The 2-pixel limits (35 mm: about 91 µm / 50 mm: about 63 µm / 85 mm: about 43 µm) are a guideline for whether shape can be resolved; with Photometric Stereo, scratches narrower than one pixel may still be captured as changes in the normal.
Which focal length suits the size of your inspection target and the resolution you need? If you would like a measured evaluation of field of view and resolution on TR-300, or a test capture of your samples, please feel free to contact us.

