Catching Every Crack: How E3 ENGINE® Detects Concrete Surface Defects with 99.6% Accuracy
Hairline cracks running across a bridge deck, a tunnel wall, or a concrete panel are among the hardest defects to inspect reliably. Miss one and you risk a safety issue; flag too many and you bury your inspectors in false alarms. In this article, we put TOMOMI RESEARCH's AI anomaly detection software E3 ENGINE® to the test on 24,000 real concrete surface images. We'll unpack what an AUROC of 0.998 and a 99.6% defect detection rate actually mean for your production or inspection line — and show, with real model outputs, how E3 ENGINE® doesn't just say "defective" but points to exactly where the anomaly is, pixel by pixel.
Why Crack Detection Is So Hard
Detecting cracks on concrete surfaces is one of the tougher problems in visual inspection, for three reasons:
- Defects have no fixed shape. Cracks vary endlessly in width, length, branching, and direction. There is no single "template" to match against.
- The background is noisy. Concrete naturally has aggregate texture, color variation, stains, and shadows that mimic real cracks.
- Defect samples are scarce. A real-world line produces endless images of good surfaces, but collecting a comprehensive library of every defect pattern is impractical.
Conventional approaches that learn from large libraries of defect examples carry a built-in risk: they can miss crack shapes they never saw during training. This is exactly where an anomaly detection approach changes the game.
The E3 ENGINE® Approach: Learn What "Normal" Looks Like
Rather than learning from defect samples, E3 ENGINE® learns the appearance of the normal surface. The model internalizes the expected texture and pattern distribution of defect-free concrete, then scores any region that deviates from it as anomalous.
The advantages are clear:
- Robust to unseen defects. A crack of a shape never encountered in training is still flagged — simply because it is "not normal."
- Easy to deploy. Training centers on the readily available good samples, minimizing the burden of collecting defect imagery.
- Explainable decisions. The engine outputs a score map showing which pixels are anomalous and by how much — no black box.
The Results: Validated on 24,000 Images
We evaluated E3 ENGINE® on a test set of 24,000 concrete surface images (4,000 good / 20,000 defective).
Anomaly Scores Cleanly Separate Good from Defective
E3 ENGINE® assigns each image an anomaly score. The histogram below shows the score distributions for good and defective (NG) images. Good images cluster around 0.24 and defective ones around 0.45, forming two clearly separated populations on either side of the optimal threshold of 0.34. The smaller the overlap, the more stable and reliable the automated decision.
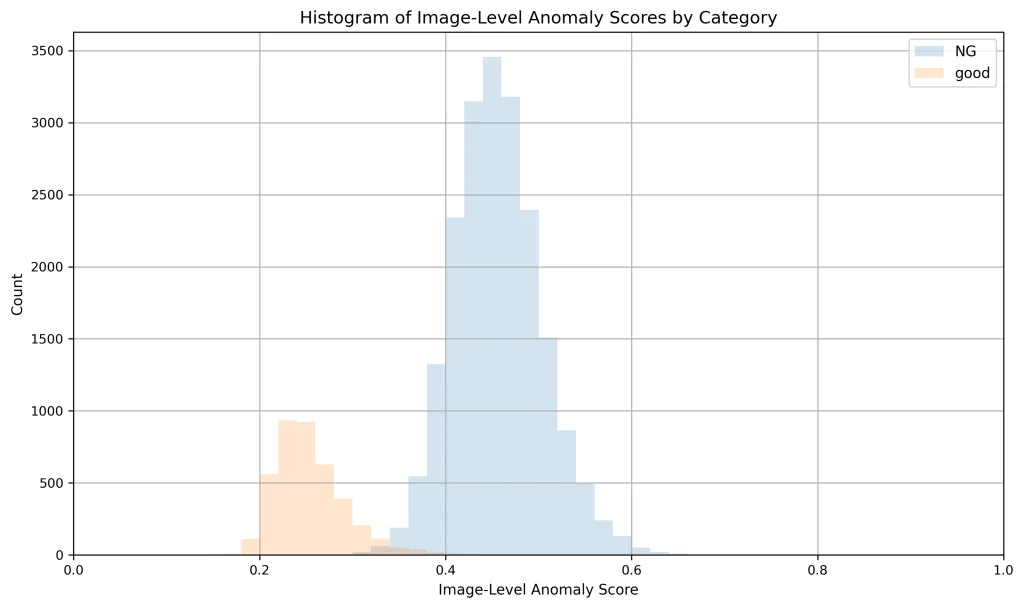
Histogram of image-level anomaly scores. Good images cluster near 0.24, defective near 0.45, separated by the thresholdHistogram of image-level anomaly scores. Good images cluster near 0.24, defective near 0.45, separated by the threshold
AUROC 0.998 — Near-Perfect Discrimination
The aggregate performance metrics reached exceptional levels:
| Metric | Value | What it means |
|---|---|---|
| AUROC | 0.998 | Ability to separate good from defective. 1.0 is perfect; 0.998 is near-ideal |
| AP (Average Precision) | 0.999 | Overall balance of precision and recall |
| F1 score | 0.995 | Balance of misses vs. false alarms (at the 0.338 threshold) |
The ROC curve hugs the top-left corner, yielding an AUROC of 0.998 — meaning the engine catches defects reliably while almost never mistaking a good surface for a defective one.
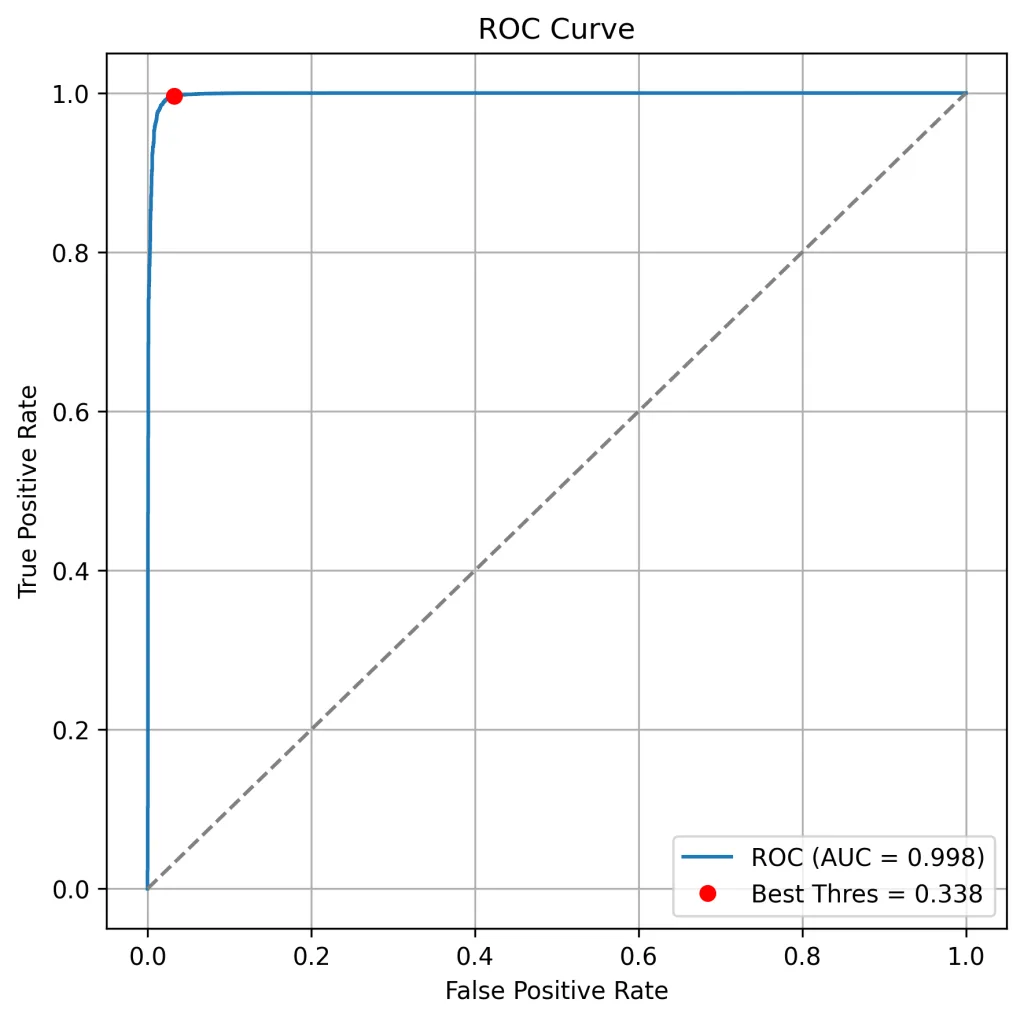
ROC curve hugging the top-left corner, AUROC 0.998
99.6% Detection Rate — Only 0.37% Missed
In real operations, the question that matters most is: how much slips through? The confusion matrix at the optimal threshold tells the story:
| Predicted Defective | Predicted Good | |
|---|---|---|
| Actually Defective (20,000) | 19,927 (caught) | 73 (missed) |
| Actually Good (4,000) | 131 (false alarm) | 3,869 (correct) |
- 99.6% detection rate (recall) — 19,927 of 20,000 defects correctly caught.
- 0.37% miss rate — just 73 missed (about 1 in 274).
- 99.3% precision — 99.3% of everything flagged as defective truly was.
For safety-critical infrastructure inspection, a low miss rate is decisive — and E3 ENGINE® holds misses below 1%.
Beyond Pass/Fail: Explainable, Pixel-Level Localization
E3 ENGINE®'s real value goes past a simple verdict. It visualizes exactly where the anomaly is, pixel by pixel. Below is the processing pipeline for a defective image:
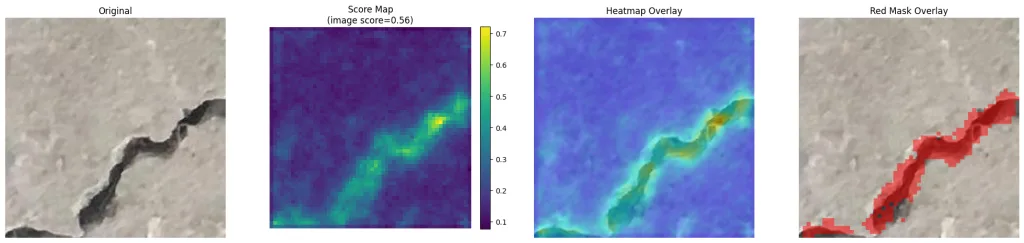
From left to right: ① the original image → ② a per-pixel anomaly score map → ③ a heatmap overlaid on the original → ④ a red mask highlighting the defect region. What stands out is how faithfully the red mask traces the winding path of the crack. Instead of merely declaring "this image is defective," E3 ENGINE® shows your team this exact line is the anomaly — feeding directly into inspector review, record-keeping, and pinpointing repair locations.
For a good image, the score falls below the threshold and no red mask appears. E3 ENGINE® delivers exactly the behavior a real inspection line needs: it marks only what is genuinely anomalous and lets clean surfaces pass quietly.
Conclusion
Faced with the demanding task of concrete crack detection, E3 ENGINE® delivered the following on 24,000 real images:
- AUROC 0.998 / AP 0.999 / F1 0.995 — near-ideal discrimination
- 99.6% detection rate, 0.37% miss rate — high reliability where safety depends on it
- Pixel-level anomaly visualization — explainable AI that shows where the defect is
- Normal-based anomaly detection — robust to unseen defects, fast to deploy
Together, these form a solid foundation for consistent, 100% automated inspection that doesn't depend on the human eye — from surface inspection in manufacturing to infrastructure and structural monitoring. E3 ENGINE® is an AI that catches defects, avoids false alarms, and explains its reasoning, supporting both quality assurance and labor savings.
Interested in E3 ENGINE®'s anomaly detection — or in a proof-of-concept on your own inspection target? Send us sample images of your parts or surfaces, and we'll propose a validation tailored to your use case. For technical consultation, deployment inquiries, or press, please reach out through the TOMOMI RESEARCH website (https://www.tomomi-research.com/), or by email (info@tomomi-research.com / Tel: +81-466-54-9003).