
Tech Blog: The Front Line of Industrial Image Anomaly Detection: An Overview of Deep Learning Approaches and Implementation Guidelines
 kotai2003
Original title: Deep Industrial Image Anomaly Detection: A Survey
Authors: Jiaqi Liu, Guoyang Xie, Jinbao Wang, Shangnian Li, Chengjie Wang, Feng Zheng & Yaochu Jin
https://link.springer.com/article/10.1007/s11633-023-1459-z
TL;DR (Three-Line Summary)
- Systematically organizes IAD methods with a taxonomy that combines the level of supervision (unsupervised, supervised, few-shot, etc.) with network architecture.
- Compiles image-level AUROC (Table 9) and pixel-level AUROC and AU-PR (Table 10) for each method on MVTec AD. Memory-bank methods are found to be the most effective at image level, but weak at detecting pixel-level anomalies.
- Extracts a "promising setting" from industrial manufacturing and reviews existing methods under that setting.
Introduction
Quality control on production lines must not let fine defects slip through. Manual visual inspection has long been the norm, but with deep learning dramatically improving the accuracy of image recognition, Industrial Image Anomaly Detection (IAD) is becoming a realistic option.
However, the research community classifies methods only by "network architecture" or by "supervised vs. unsupervised level of supervision," and the overall picture that links them to the requirements industrial sites face, such as "real-time performance," "data scarcity," and "edge implementation," remains scattered. Based on the survey by Liu et al. published in 2024 (Machine Intelligence Research, vol. 21, pp. 104-135), this article presents a framework that bridges the gap between academic findings and industrial implementation.
Background and Related Work
IAD research falls broadly into two groups.
- Unsupervised reconstruction-based: reconstructs the input image and judges anomalies by the reconstruction error (e.g., DRAEM, FastFlow).
- Feature-embedding-based: learns an embedding space from normal images and measures anomalies with a distance metric (e.g., PatchCore, RD4AD).
Among earlier reviews, Czimmermann et al. (2020) focus mainly on traditional methods with little discussion of deep learning, and Tao et al. (2022) focus on unsupervised anomaly localization. This survey uses twice as many IAD datasets as Tao et al. and compares the performance of existing methods across both image-level and pixel-level metrics.
Core Idea
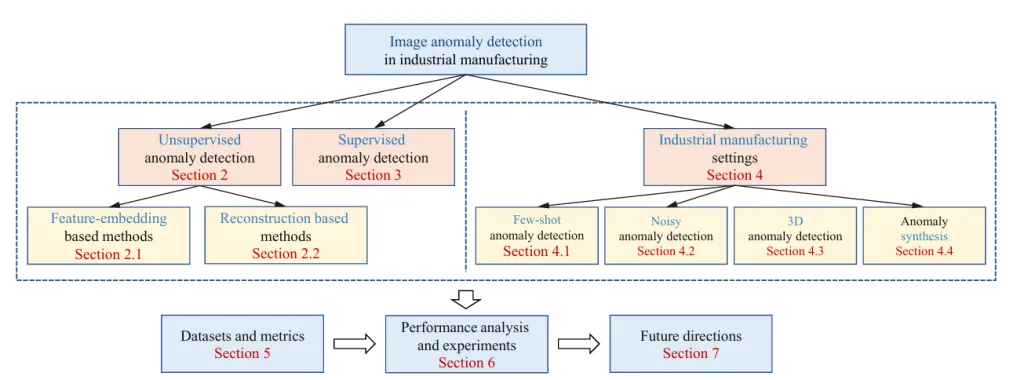
The central concept of this survey is the "level of supervision × network architecture" taxonomy. The level of supervision is divided into the following five groups.
| Level of supervision | Examples |
|---|---|
| Unsupervised | RD4AD, PatchCore |
| Supervised | AST, IKD |
| Few-shot | Few-shot IAD family |
| Noisy | Noisy AD family |
| Anomaly synthesis | Anomaly synthesis family |
Network architecture is subdivided into memory-bank, teacher-student, and generative-model types, and the loss function corresponding to each architecture (cosine similarity, context similarity, L2, etc.) is visualized alongside. This yields a design guideline for judging intuitively "which architecture is best at which level of supervision."
Method Details
1. Components of the Taxonomy
- Memory-bank type (e.g., PatchCore, RD4AD)
Stores feature vectors of normal images in memory and, at test time, uses the distance to the nearest vector as the anomaly score. RD4AD introduces multi-scale feature fusion (MFF) and a one-class bottleneck (OCB), achieving high accuracy with a single teacher-student pair.
-
Teacher-student type (e.g., AST, IKD)
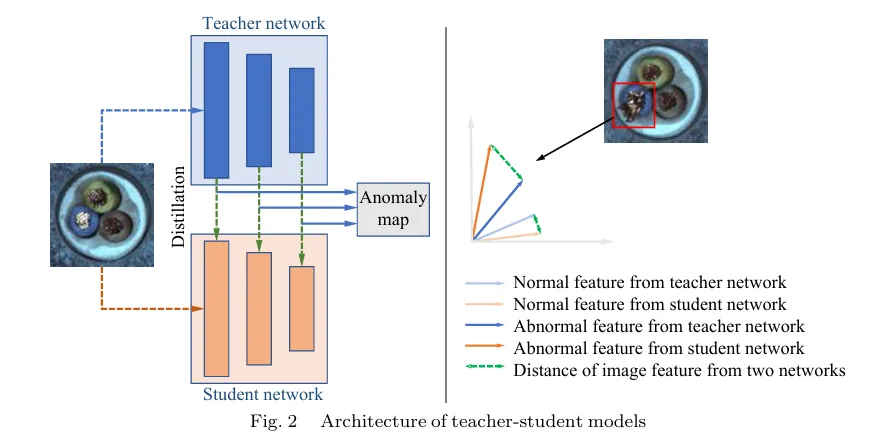
A teacher network extracts features and a student network reproduces them. AST combines an asymmetric architecture with normalizing flows to reduce bias in the reconstruction error. IKD adds a context similarity loss (CSL) and adaptive hard sample mining (AHSM) to suppress overfitting. -
Generative-model type (e.g., diffusion and GAN families)
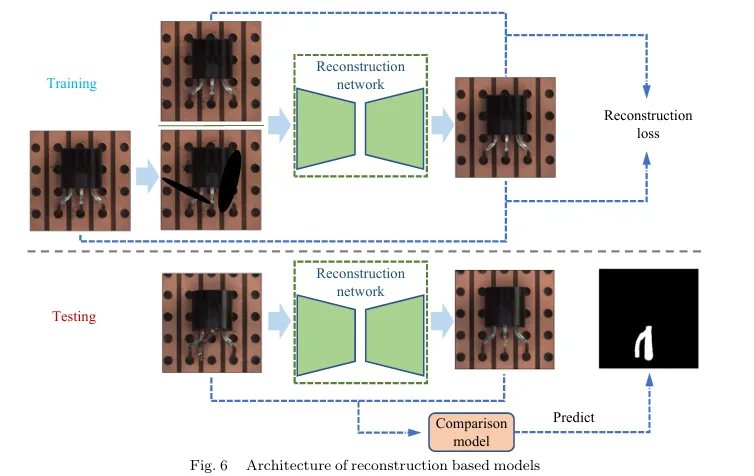
Learns a generative model from normal data and treats regions that are hard to generate as anomalies. Diffusion models in particular can generate high-quality samples and are useful for simulating anomaly scenarios.
2. Loss Functions and Optimization
| Method | Loss function |
|---|---|
| RD4AD | Cosine similarity |
| IKD | Context similarity |
| AST | L2 + log-likelihood |
| PatchCore | Feature distance (L2) |
The loss function minimizes feature mismatch in the teacher-student type, distance in the embedding space in the memory-bank type, and pixel-level reconstruction error in the generative-model type. This makes explicit that the focus of optimization changes with the level of supervision.
As shown in Fig. 6, the teacher-student contrast flow computes the anomaly score as follows: "normal or anomalous image → reconstruction network → training with a reconstruction loss → at inference, comparison of the original and reconstructed images."
Experiments and Results
Evaluation Setup
- Benchmark: MVTec AD (15 classes)
- Metrics: image-level AUROC (Table 9), pixel-level AUROC and AU-PR (Table 10)
- Methods compared: PatchCore, RD4AD, DRAEM, FastFlow, AST, IKD, MemSeg, and others
Key Numerical Results
Representative methods taken from Table 9 below (image-level AUROC, average over the 15 MVTec AD classes).
| Method | Architecture | Image-level AUROC (average) |
|---|---|---|
| PatchCore | Memory bank | 0.992 |
| PatchCore (ensemble) | Memory bank | 0.996 |
| AST | Teacher-student | 0.992 |
| FastFlow | Distribution map | 0.994 |
From Tables 9 and 10 and Fig. 7, the paper draws the following conclusions.
- For image-level anomaly detection, memory-bank approaches are the most effective network design, but they are weak at detecting pixel-level anomalies.
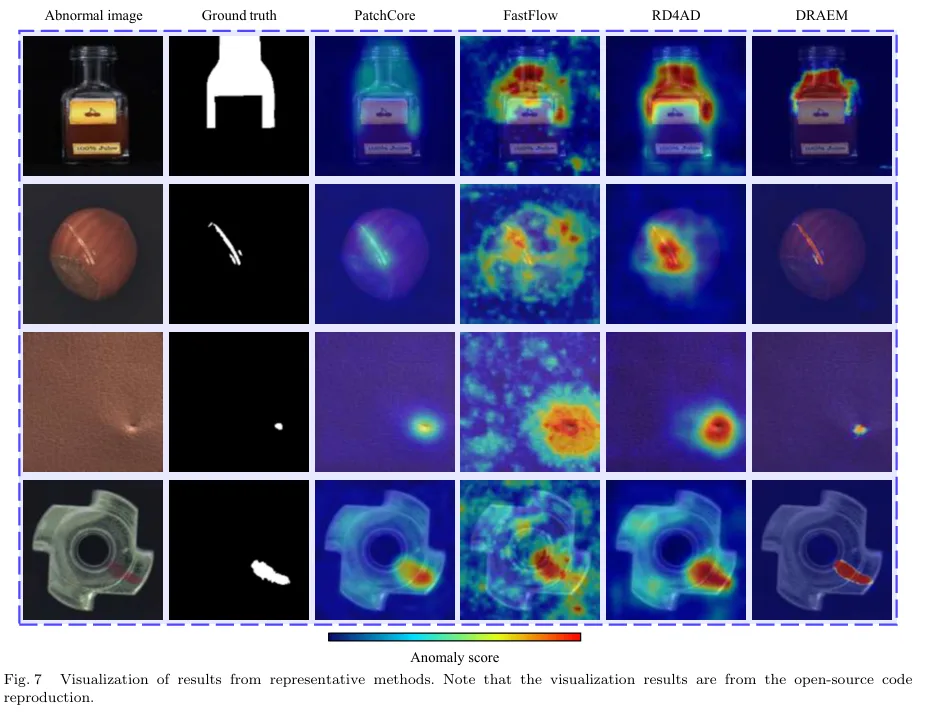
- Even methods with similar image classification performance differ significantly in pixel-level segmentation (Fig. 7).
- Ensemble learning can dramatically improve the performance of state-of-the-art methods.
- SSPCAB can be integrated directly into state-of-the-art methods and significantly improves reconstruction-based methods.
- The gap between few-shot IAD and vanilla IAD is narrowing.
- Without ensembles, MemSeg achieves the SOTA result for image-level classification, and DRAEM outperforms other methods in pixel-level segmentation. Both use a U-Net segmentation module, and the paper concludes that a segmentation module is beneficial for anomaly detection.
- AU-PR is more valuable than AU-ROC for segmentation, and reconstruction-based methods lead on pixel-level AU-PR (Table 10).
Table 9: Image AUROC (MVTec AD)
Memory bank
| Method | Bottle | Cable | Capsule | Carpet | Grid | Hazelnut | Leather | Metal nut | Pill | Screw | Tile | Toothbrush | Transistor | Wood | Zipper | Avg |
|---|---|---|---|---|---|---|---|---|---|---|---|---|---|---|---|---|
| PatchCore | 1.000 | 0.997 | 0.981 | 0.982 | 0.983 | 1.000 | 1.000 | 1.000 | 0.971 | 0.990 | 0.989 | 0.989 | 0.997 | 0.999 | 0.997 | 0.992 |
| PatchCore ensemble | – | – | – | – | – | – | – | – | – | – | – | – | – | – | – | 0.996 |
| CFA | 1.000 | 0.998 | 0.973 | 0.973 | 0.992 | 1.000 | 1.000 | 1.000 | 0.979 | 0.973 | 0.994 | 1.000 | 1.000 | 0.997 | 0.996 | 0.993 |
| FAPM | 1.000 | 0.995 | 0.986 | 0.993 | 0.980 | 1.000 | 1.000 | 1.000 | 0.960 | 0.952 | 0.994 | 1.000 | 1.000 | 0.993 | 0.995 | 0.990 |
| N-pad | 1.000 | 0.995 | 0.994 | 0.993 | 0.987 | 1.000 | 1.000 | 1.000 | 0.980 | 0.974 | 1.000 | 1.000 | 0.996 | 0.996 | 0.993 | 0.994 |
| N-pad ensemble | 1.000 | 0.998 | 0.995 | 1.000 | 0.986 | 1.000 | 1.000 | 1.000 | 0.972 | 0.989 | 1.000 | 0.997 | 1.000 | 0.994 | 0.998 | 0.995 |
| MSPB | 1.000 | 0.988 | 0.972 | 0.934 | 1.000 | 0.996 | 0.993 | 0.978 | 0.977 | 0.941 | 0.962 | 1.000 | 0.989 | 0.997 | 0.995 | 0.981 |
| SPDI | – | – | – | – | – | – | – | – | – | – | – | – | – | – | – | 0.990 |
| SPADE | – | – | – | – | – | – | – | – | – | – | – | – | – | – | – | 0.855 |
| [62] | – | – | – | – | – | – | – | – | – | – | – | – | – | – | – | 0.921 |
| SOMAD | 1.000 | 0.988 | 0.988 | 1.000 | 0.939 | 1.000 | 1.000 | 0.997 | 0.986 | 0.955 | 0.987 | 0.986 | 0.945 | 0.992 | 0.977 | 0.979 |
| RD4AD | 1.000 | 0.950 | 0.963 | 0.989 | 1.000 | 0.999 | 1.000 | 1.000 | 0.966 | 0.970 | 0.993 | 0.995 | 0.967 | 0.992 | 0.985 | 0.985 |
| STFPM | – | – | – | – | – | – | – | – | – | – | – | – | – | – | – | 0.955 |
Teacher-student
| Method | Bottle | Cable | Capsule | Carpet | Grid | Hazelnut | Leather | Metal nut | Pill | Screw | Tile | Toothbrush | Transistor | Wood | Zipper | Avg |
|---|---|---|---|---|---|---|---|---|---|---|---|---|---|---|---|---|
| Uninformed students | 0.918 | 0.865 | 0.916 | 0.695 | 0.819 | 0.937 | 0.819 | 0.895 | 0.935 | 0.928 | 0.912 | 0.863 | 0.701 | 0.725 | 0.933 | 0.857 |
| MKD | 0.994 | 0.892 | 0.805 | 0.793 | 0.780 | 0.984 | 0.951 | 0.736 | 0.827 | 0.833 | 0.916 | 0.922 | 0.856 | 0.943 | 0.932 | 0.877 |
| STPM | 1.000 | 0.996 | 0.930 | 0.987 | 1.000 | 0.998 | 1.000 | 1.000 | 0.981 | 0.968 | 0.999 | 0.979 | 0.983 | 0.993 | 0.993 | 0.987 |
| AST | 1.000 | 0.985 | 0.997 | 0.975 | 0.991 | 1.000 | 1.000 | 0.985 | 0.991 | 0.997 | 1.000 | 0.966 | 0.993 | 1.000 | 0.991 | 0.992 |
Distribution map
| Method | Bottle | Cable | Capsule | Carpet | Grid | Hazelnut | Leather | Metal nut | Pill | Screw | Tile | Toothbrush | Transistor | Wood | Zipper | Avg |
|---|---|---|---|---|---|---|---|---|---|---|---|---|---|---|---|---|
| Rippel et al. | 0.998 | 0.955 | 0.938 | 1.000 | 0.817 | 0.996 | 0.997 | 0.947 | 0.884 | 0.854 | 0.998 | 0.964 | 0.963 | 0.986 | 0.978 | 0.953 |
| Rippel et al. (2) | – | – | – | – | – | – | – | – | – | – | – | – | – | – | – | 0.971 |
| PEDENet | – | – | – | – | – | – | – | – | – | – | – | – | – | – | – | 0.928 |
| PFM | 1.000 | 0.988 | – | 1.000 | 0.980 | 1.000 | 1.000 | 1.000 | 0.965 | 0.918 | 0.996 | 0.886 | 0.978 | 0.995 | 0.974 | 0.975 |
| FYD | 1.000 | 0.953 | 0.925 | 0.988 | 0.989 | 0.999 | 1.000 | 0.999 | 0.945 | 0.901 | 0.988 | 1.000 | 0.992 | 0.994 | 0.975 | 0.977 |
| FastFlow | 1.000 | 1.000 | 1.000 | 1.000 | 0.997 | 1.000 | 1.000 | 1.000 | 0.994 | 0.978 | 1.000 | 0.944 | 0.998 | 1.000 | 0.995 | 0.994 |
| DifferNet | 0.990 | 0.959 | 0.869 | 0.929 | 0.840 | 0.993 | 0.971 | 0.961 | 0.888 | 0.963 | 0.994 | 0.986 | 0.911 | 0.998 | 0.951 | 0.949 |
| CS-Flow | 0.998 | 0.991 | 0.971 | 1.000 | 0.990 | 0.996 | 1.000 | 0.991 | 0.986 | 0.976 | 1.000 | 0.919 | 0.993 | 1.000 | 0.997 | 0.987 |
| CFLOW-AD | 0.989 | 0.975 | 0.988 | 0.990 | 0.988 | 0.990 | 0.996 | 0.988 | 0.984 | 0.991 | 0.965 | 0.988 | 0.952 | 0.950 | 0.991 | 0.982 |
| CS-Flow+AltUB | 1.000 | 0.978 | 0.981 | 0.992 | 1.000 | 1.000 | 1.000 | 0.995 | 0.970 | 0.917 | 0.999 | 0.994 | 0.952 | 0.990 | 0.985 | 0.984 |
As shown in Fig. 7, the visualization of the experimental results compares the anomaly-score heatmaps of representative methods with the original images, clearly highlighting local defect regions.
What This Research Means
- Academic impact
With the taxonomy, researchers can position methods by the combination of "level of supervision × network architecture," establishing a foundation for comparing papers on a unified basis. - Industrial impact
The paper points out that on a production line, test samples arrive one after another, so inference speed matters as well as accuracy. By reviewing existing methods under a "promising setting" taken from industrial manufacturing, it lets research evaluations be discussed against the requirements of the factory floor. -
Rules of thumb for choosing a technique (from the paper's analysis)
- Main goal is image-level pass/fail → memory-bank type (e.g., PatchCore)
- Need to capture the position and shape of defects at pixel level → reconstruction-based methods or methods with a segmentation module (e.g., DRAEM, MemSeg)
- Not enough anomalous samples → anomaly synthesis methods (e.g., CutPaste, DRAEM, MemSeg)
Future Research Directions (the Paper's Recommendations)
- Multi-modal IAD datasets: on real assembly lines, RGB images alone are not enough, and information such as X-ray and ultrasound should also be used.
- Balancing inference speed and accuracy: few methods can return a prediction as soon as a sample arrives on the line. Multi-objective evolutionary neural architecture search is a promising way to find the best trade-off.
- Pre-trained models for industrial images: most methods extract features with ImageNet pre-trained models, which inevitably causes feature drift.
- Fully supervised datasets with pixel-level annotations: the focus on the unsupervised setting has held back segmentation-based methods.
- Synthesizing anomalous samples: most production lines have few defects, so collecting many anomalous samples is hard.
- Lightweight, efficient models: work has focused on accuracy while overlooking model size and efficiency.
- Unifying industrial and medical image anomaly detection: the two share much in data and experimental settings, but few studies treat them together.
Summary
Built around the two-axis taxonomy of level of supervision × network architecture, this survey comprehensively organizes industrial image anomaly detection methods. The performance compiled on MVTec AD shows the strengths and weaknesses of each approach: memory-bank methods are strong at image level, while reconstruction-based methods and methods with a segmentation module do better at pixel level. The "promising setting" taken from industrial manufacturing and the recommended research directions offer a bridge between academic research and implementation on the factory floor.