
Seeing a Populated Circuit Board as "Color" and "Shape": PCB Visual Inspection and Four Image Representations
 kotai2003
In visual inspection of populated circuit boards, many items concern “shape”: solder shape, lifted components, bent leads and so on. In an ordinary color image, however, solder and leads strongly reflect the lighting and glow white, which often makes the very shape you need hard to read.
How can you see the “shape” of metal parts that glare in a color photo? In this article, we capture a populated printed circuit board with TR-100 (technology: FORESIGHT STEREO®) and compare four image representations obtained from the same single capture.
What we captured: the control board of a commercially available HDD (good part)
The subject is the control board of a commercially available HDD (an in-house sample). It is a very typical populated board, carrying surface-mount components such as a QFP (an IC package with leads extending from all four sides), chip resistors and capacitors, and SOPs, as well as through-holes and connectors.
- Capture system: TR-100 (AI visual inspection system)
- Technology: FORESIGHT STEREO
- Capture date: August 29, 2026
- Condition: good part with no defects
This capture was not made to look for defects. It is a record of observing how a good board appears in each mode.
Comparing the whole board in four modes
FORESIGHT STEREO outputs the following four types of images from a single capture.
| Mode | What it represents | What we saw on this board |
|---|---|---|
| LIVE | The appearance as seen by an ordinary camera (color) | Green solder resist and gold lands; metal parts are blown out |
| 2D Texture | Surface color and pattern with shading and reflections removed | Silkscreen printing and markings are readable in an even tone |
| 3D Surface | Surface relief rendered like an embossed image | Undulations of the traces, rows of leads, component outlines |
| Surface Normal | Surface orientation represented by color (surface normal map) | Component edges and the boundaries of raised areas |
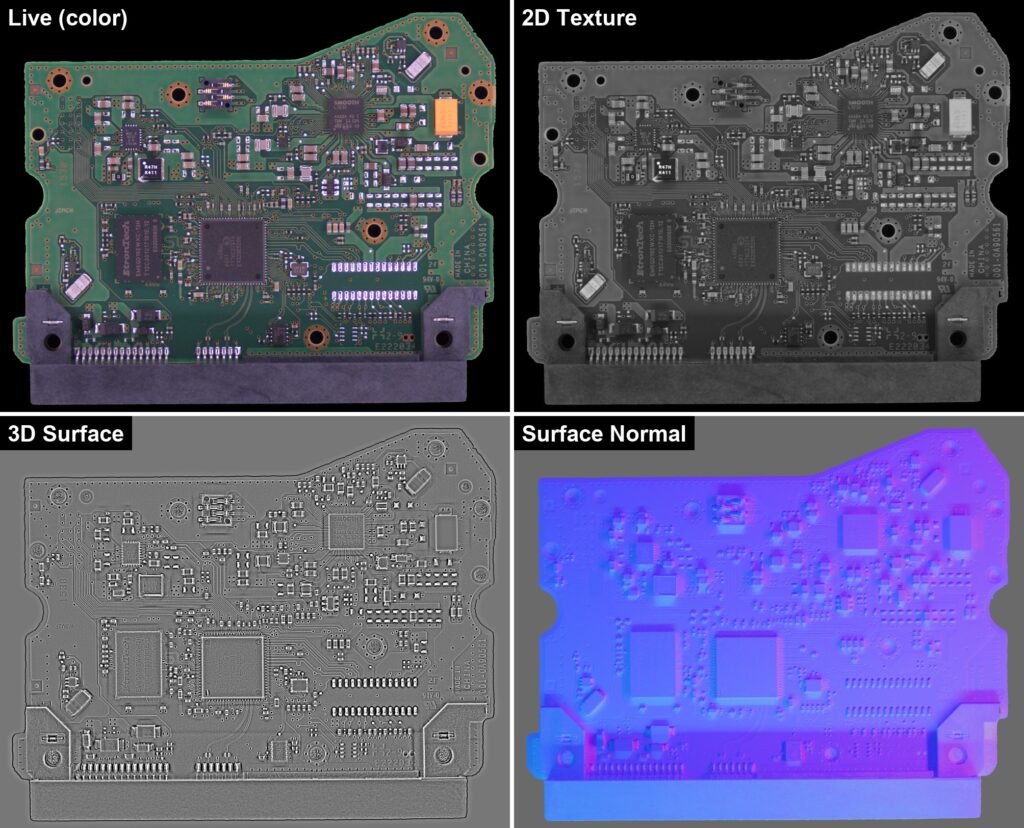
The whole board compared in four modes. Even for the same board, the impression changes greatly depending on whether you look at color or shape.
Seen side by side as a whole, LIVE is dominated by the appearance of “components on a green board.” In 3D Surface and Surface Normal, by contrast, the color information disappears, and what comes to the fore is which parts of the board are raised and where it is flat.
Comparing a close-up around the main IC
Next, we zoom in on the main IC (QFP) and its surroundings.
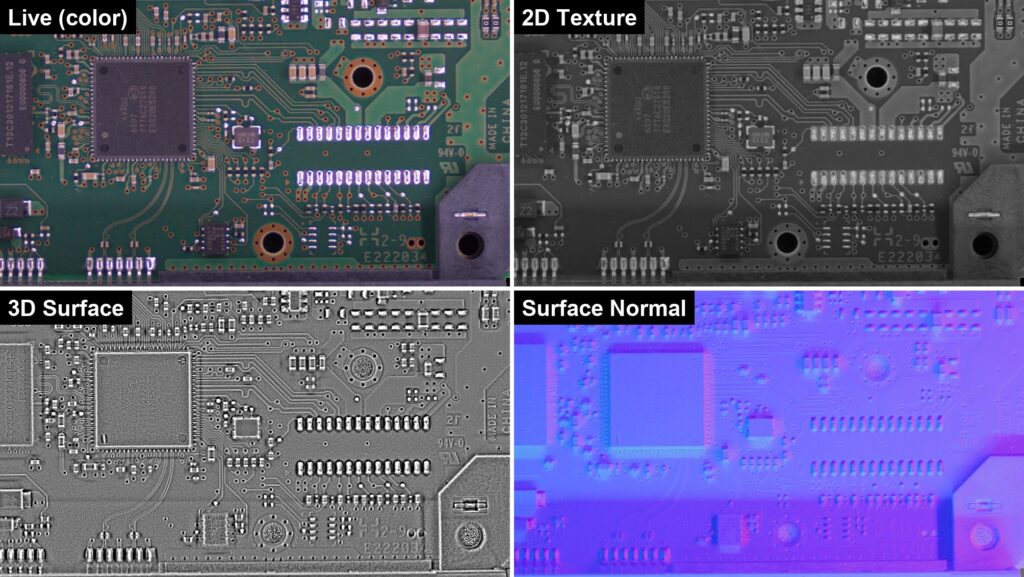
Close-up comparison around the main IC (top left: LIVE, top right: 2D Texture, bottom left: 3D Surface, bottom right: Surface Normal).
LIVE: a familiar view, but metal parts glare
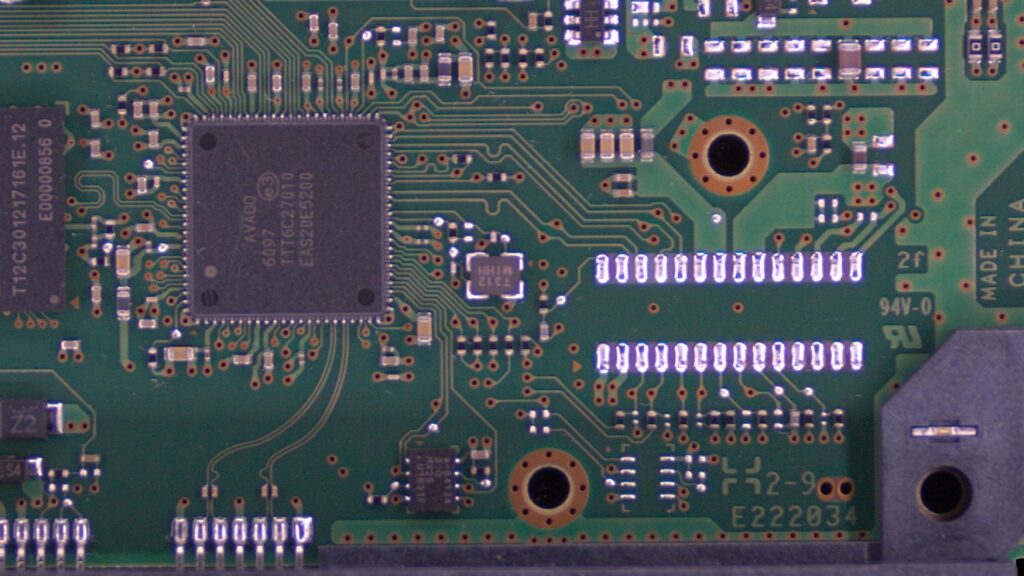
LIVE: the solder and pad rows glow white from specular reflection.
LIVE is the image you would normally see through a camera. The green solder resist (the insulating film covering the board surface) and the gold through-hole lands are clearly visible. On the other hand, the solder, leads and pads show strong specular reflection (blown-out highlights), turning the metal parts into blobs of light whose shape is hard to read.
2D Texture: reflections suppressed, text and patterns readable
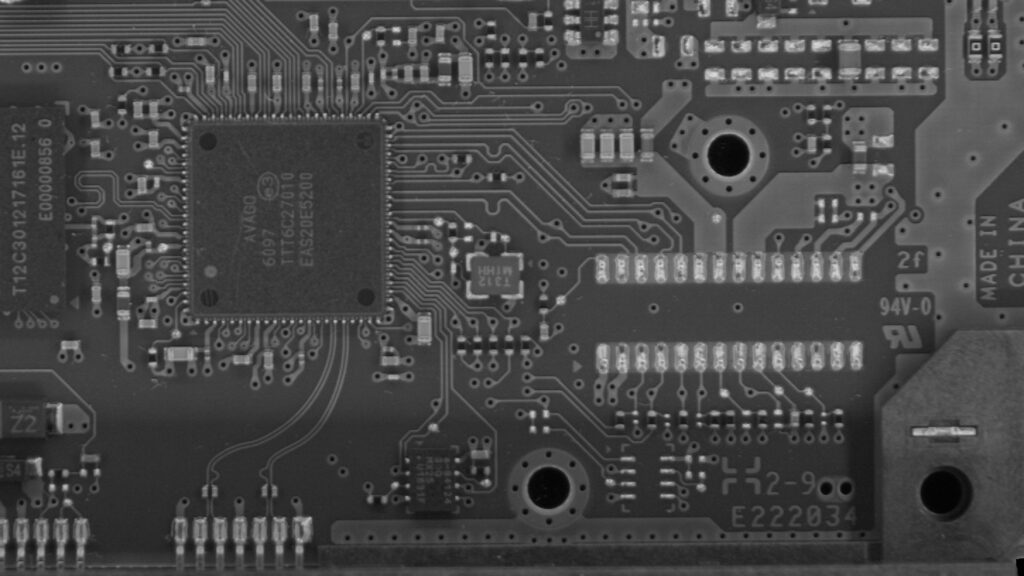
2D Texture: the silkscreen printing and IC markings are readable in an even tone.
In LIVE, brightness varied with how the light fell, but in 2D Texture, reflections and shading are suppressed. The silkscreen “94V-0” and “2-9,” the part-number text and the IC markings can be read in an even tone, and the blown-out highlights on the pad rows are also reduced. This is the representation for seeing “what is drawn on the surface.”
3D Surface: color removed, only the relief brought out
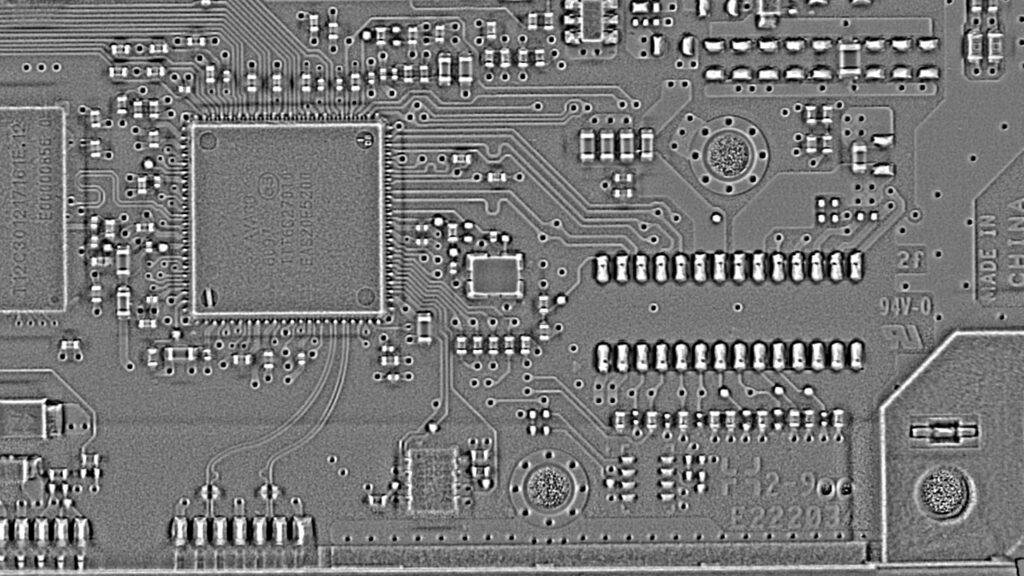
3D Surface: the QFP lead rows, chip component outlines and trace undulations appear three-dimensional.
Areas that glared and could not be seen in LIVE appear in 3D Surface as three-dimensional shape. The color information disappears, and the undulations of the trace pattern running under the solder resist, the QFP lead rows, the chip component outlines, the pad rows and the shapes around the through-holes stand out as if embossed. Even the silkscreen text appears as slight relief.
Surface Normal: surface orientation shown in different colors
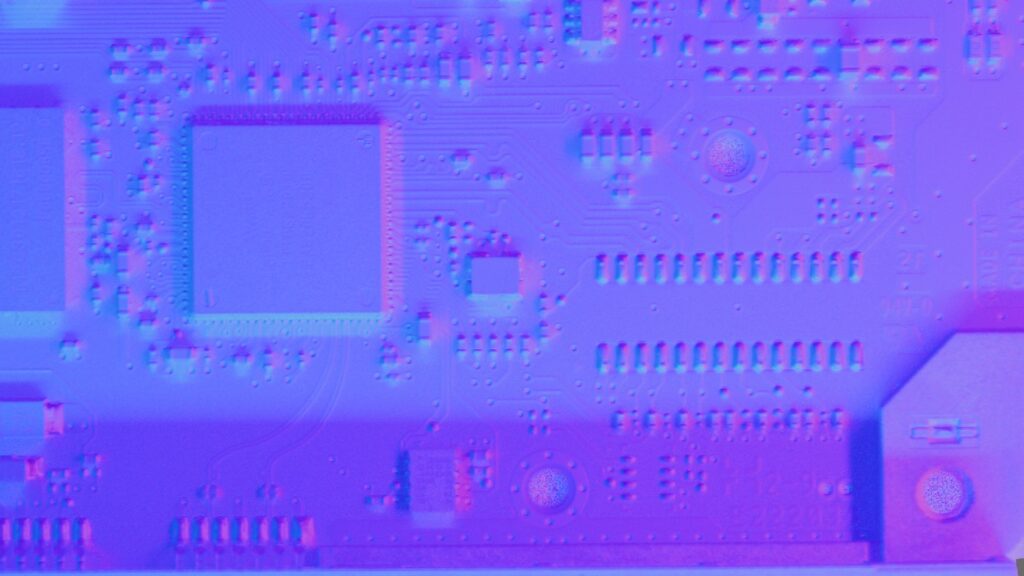
Surface Normal: the edges of IC packages and connectors, and raised components, are separated by color.
A normal is the direction a surface faces. Surface Normal represents this direction with color, so the flat board surface becomes a uniform color, while places where the surface orientation changes, such as the edges of IC packages and connectors and raised components, are clearly separated. It is a representation that makes it easy to grasp “where the shape changes” without being misled by the colors and patterns in LIVE.
Why color and shape can be extracted separately: Photometric Stereo
FORESIGHT STEREO is built on a technique called Photometric Stereo. When an object is lit and captured from several directions, the way its brightness changes differs with the tilt of the surface. From those differences, the direction each point of the surface faces (the normal) is estimated.
Once the surface orientation is known, the effects of shading and reflection caused by the lighting can be handled separately from the color and pattern of the surface itself. This is how a “color and pattern” image and a “shape” image can be extracted separately from the same capture.
Implications for PCB visual inspection: for evaluating items where “shape” matters
From this observation, we believe that representations such as 3D Surface and Surface Normal may be useful when evaluating the following PCB visual inspection items, where “shape” is important.
- Solder shape (such as how the fillet is formed)
- Lifted components
- Bent leads
- Adhering foreign matter
- Scratches
All of these are “shape” information that tends to be buried under reflections and color patterns in a color image. Being able to divide the roles, with 2D Texture for text and patterns and 3D Surface and Surface Normal for shape, should provide concrete material for evaluating inspection methods.
Next: from observing good parts to evaluation
What we have shown here is only an observation of a good part. Evaluation of how each representation shows actual defect samples is still to come.
We welcome consultations and sample capture requests from anyone who would like to check how the “shape” of their own boards or components appears. We would be glad to evaluate it together with you in light of the inspection challenges on your floor.
Summary
With FORESIGHT STEREO, “color and pattern” and “shape” can be extracted as separate images from the same single capture. Solder and leads that were blown out in the color image appeared as three-dimensional shape in 3D Surface and Surface Normal, and in 2D Texture the silkscreen printing and markings were readable in an even tone. We hope this serves as useful material when evaluating the “shape” aspects of PCB visual inspection.
For consultations on visual inspection of populated circuit boards or sample captures, please feel free to contact TOMOMI RESEARCH Inc. [https://www.tomomi-research.com/en/contact]

