[Tech Blog] What Is the ROC Curve for Machine Learning Classification Problems?
 kotai2003
In classification problems, how to evaluate a model's performance is an important question. Among the available tools, the ROC curve is widely used as an evaluation metric. This article explains the ROC curve in an easy-to-understand way, and also covers its origin and meaning in detail.
In machine learning and data science, the ROC curve is an important tool for evaluating the performance of models in classification problems. The ROC (Receiver Operating Characteristic) curve is a graph that visualizes the relationship between a classification model's true positive rate (TPR) and false positive rate (FPR).
First, let us look at where the ROC curve comes from. It was originally used during World War II to evaluate the performance of radar technology, and was later applied to fields such as medicine and testing. Today, it is widely used to evaluate classification problems in machine learning.

To understand the ROC curve, the concepts of true positive rate (TPR) and false positive rate (FPR) are essential. The true positive rate is the proportion of actually positive data that is predicted as positive. The false positive rate, on the other hand, is the proportion of actually negative data that is wrongly predicted as positive. These values are used as metrics for evaluating the performance of a classification model.
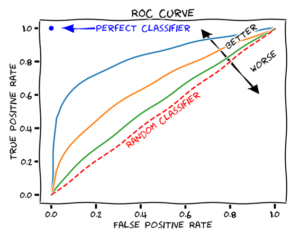
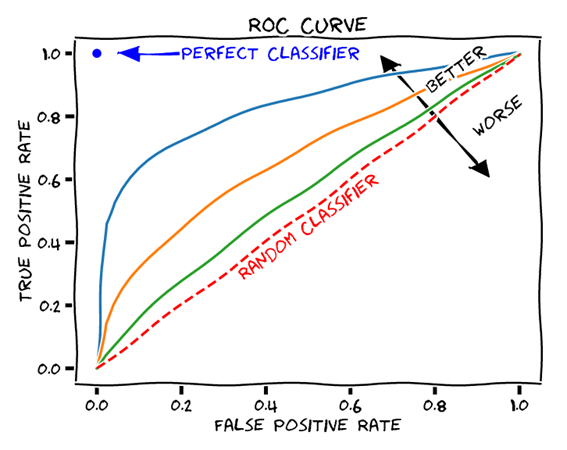
The ROC curve is drawn with the false positive rate (FPR) on the horizontal axis and the true positive rate (TPR) on the vertical axis. The shape of the curve represents the model's performance: the closer the curve is to the upper left, the better the model. In addition, the area under the ROC curve (AUC) is used as an overall metric of the model's predictive performance. The closer the AUC is to 1, the higher the model's performance.
To illustrate the concept of the ROC curve, let us take a concrete example.
For example, consider a classification model that predicts the result of a test for a certain disease. A person who tests positive and actually has the disease is a true positive, and a person who tests positive but is actually healthy is a false positive.
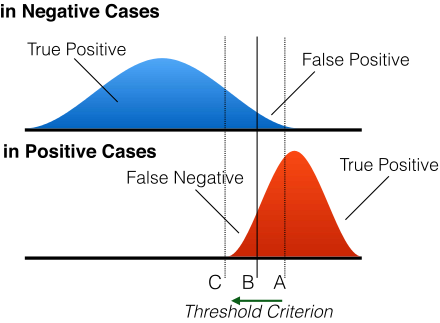
To evaluate the model's predictive performance, we set the classification criterion at various thresholds and calculate the true positive rate (TPR) and false positive rate (FPR) for each. Setting a high threshold means fewer cases are predicted as positive, so the true positive rate (TPR) goes down, but the false positive rate (FPR) also goes down. Conversely, setting a low threshold means more cases are predicted as positive, so the true positive rate (TPR) goes up, but at the same time the false positive rate (FPR) also goes up.
The ROC curve is a graph that expresses this relationship between the true positive rate (TPR) and the false positive rate (FPR). Each point on the graph corresponds to a different threshold, and the pairs of true positive rate (TPR) and false positive rate (FPR) for all thresholds are plotted. These points are then connected to draw the curve.
The shape and position of the ROC curve indicate the model's predictive performance. For example, the closer the ROC curve is to the upper left, the better the model. Also, the larger the area under the ROC curve (AUC), the higher the model's performance.
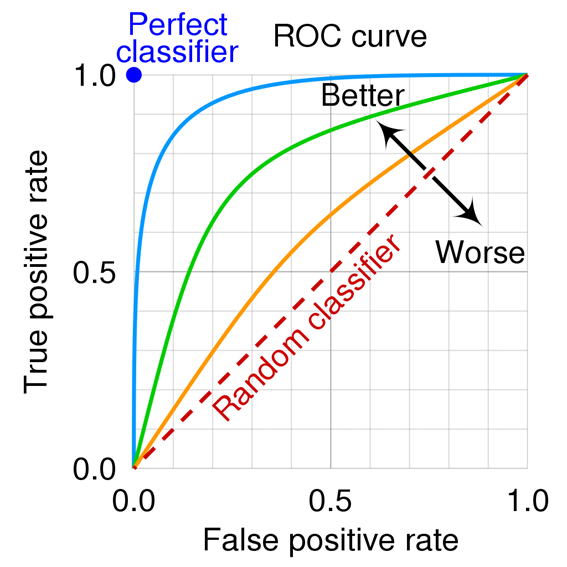
Looking at real data and graphs helps in understanding the ROC curve. Understanding the origin and significance of the ROC curve should help you understand how models are evaluated in classification problems.