
A Hands-On Guide to Evaluating AI Anomaly Detection (1/4)
 kotai2003
When companies introduce AI visual inspection, the part most often misunderstood is "evaluation."
You may be told, "We will set the threshold where F1 is highest," but what is F1, why does the threshold change the results,
and how far can you trust a figure like 100%? Discussions often move ahead before these points really sink in.
In this article, you will operate a browser-based learning app as you read, building a hands-on understanding of the evaluation process for anomaly detection
one step at a time. No formulas to memorize. Just move the sliders
and watch the numbers and graphs move together, and you will grasp the overall picture of evaluation.
App (free, no installation required)
https://anomalydetectiondemo.streamlit.app/
We recommend opening this article in a separate window and reading it while you operate the app.
All data shown is simulated data for explanation purposes, not data from real products.
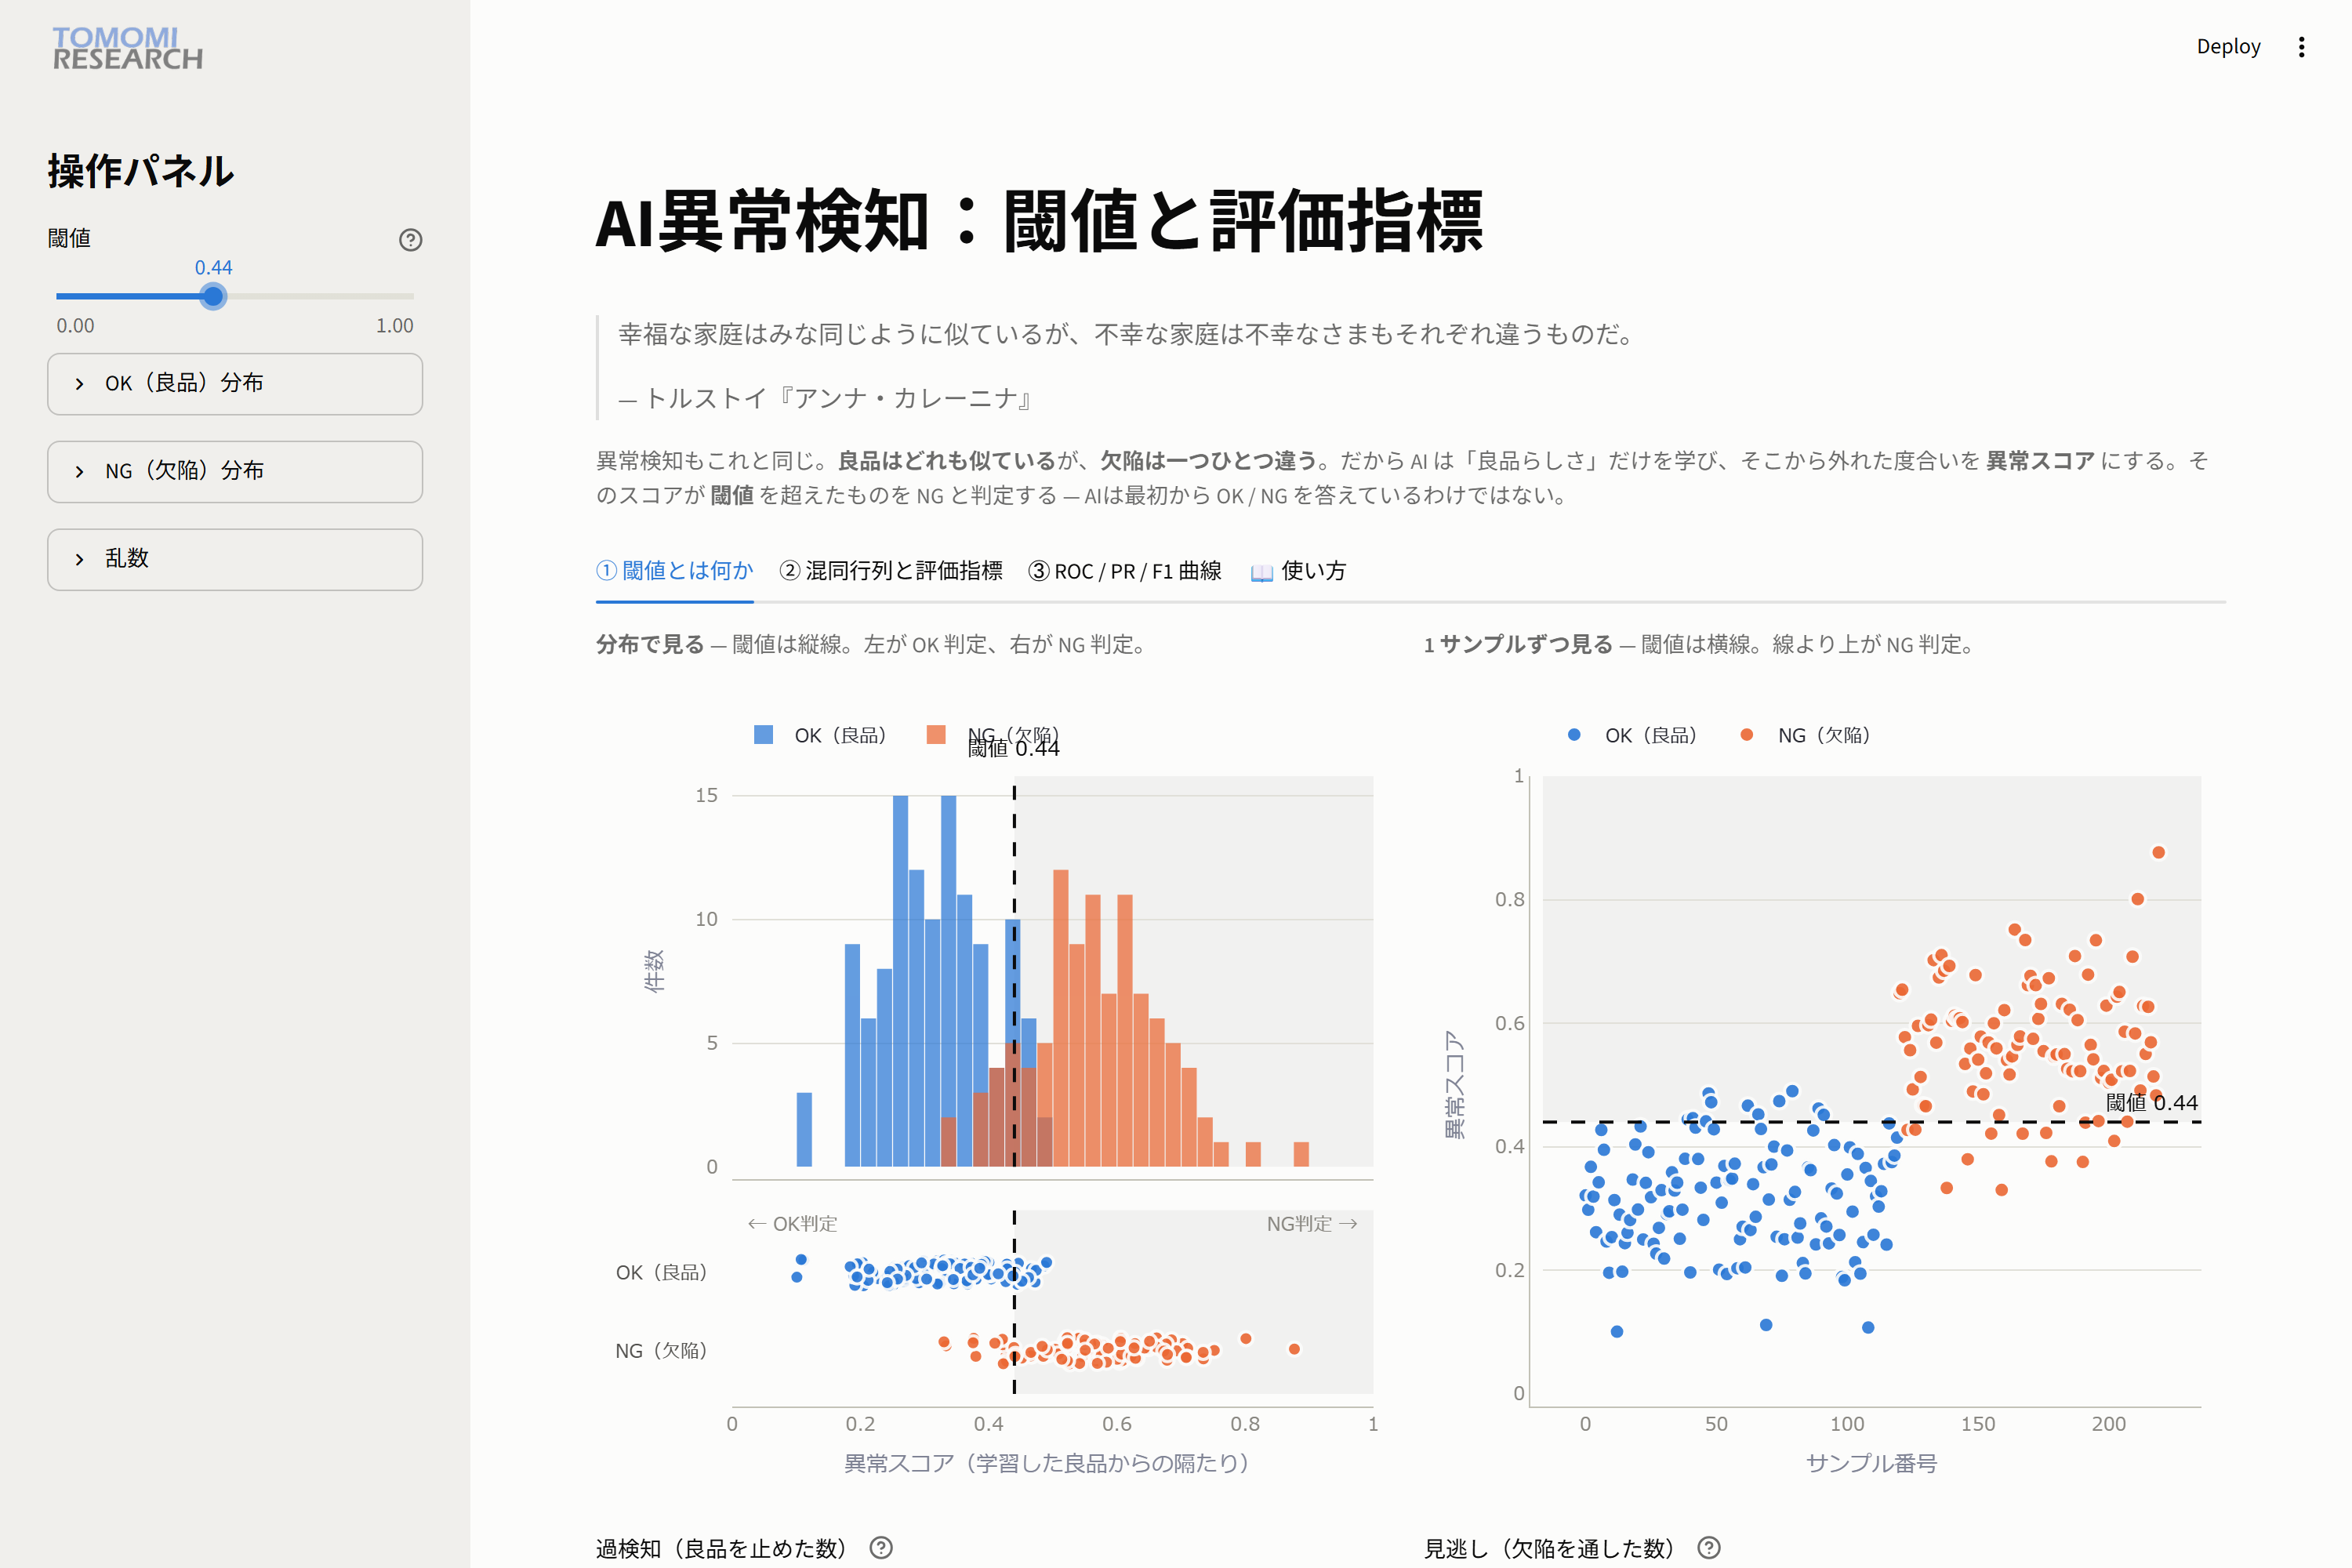
What you will learn in this tutorial
- The relationship between the anomaly score and the threshold, and the trade-off between "false detections and missed defects"
- What the confusion matrix and the five evaluation metrics (Recall / Precision / F1 and others) represent
- How to read ROC / PR / F1 curves, and five ways to set the threshold
- An evaluation pitfall: "Even the same AI gets different scores depending on the sample"
Each part includes 🖱 Try it and 👀 Observe steps. Please try them yourself.
Part 0. The premise: AI measures "how much something looks like a good part"
There is a famous line often quoted in anomaly detection.
Happy families are all alike; every unhappy family is unhappy in its own way.
— Leo Tolstoy, Anna Karenina
Good parts all look alike, but every defect is different. Scratches, dents, stains, chips...
It is impossible to collect and teach every defect pattern. So anomaly detection trained on good parts
learns only "what a good part looks like" and quantifies how far each sample deviates from it.
This value is the anomaly score (0 to 1). The more a sample looks like a good part, the smaller the score; the more it looks like a defect, the larger.
Anything that exceeds a certain line (the threshold) is judged "NG."
In other words, the AI is not saying "OK / NG" from the start.
It works in two stages: assign a score, then draw a line with the threshold.
This article digs into that "line drawing" (that is, evaluation).
Screen layout: on the left is the control panel (threshold slider and distribution settings); on the right are four tabs.
Part 1. Anomaly score and threshold: experiencing the trade-off (Tab 1)
Tab 1 has two graphs. They are two different views of the same data.
- Left: the distribution view. Blue is the score distribution for good parts (OK), orange for defects (NG). The vertical dotted line is the threshold. Anything to the right of the line is judged NG.
- Right: the per-sample view. Each dot is one product. The horizontal dotted line is the threshold. Anything above the line is judged NG.
Below the graphs are the two most important numbers.
- False detections: the number of good parts judged NG (you stopped something that did not need stopping)
- Missed defects: the number of defects judged OK (they escaped downstream)
🖱 Try it 1: move the threshold to the left (lower)
Lower the threshold slider in the left sidebar to around 0.30.
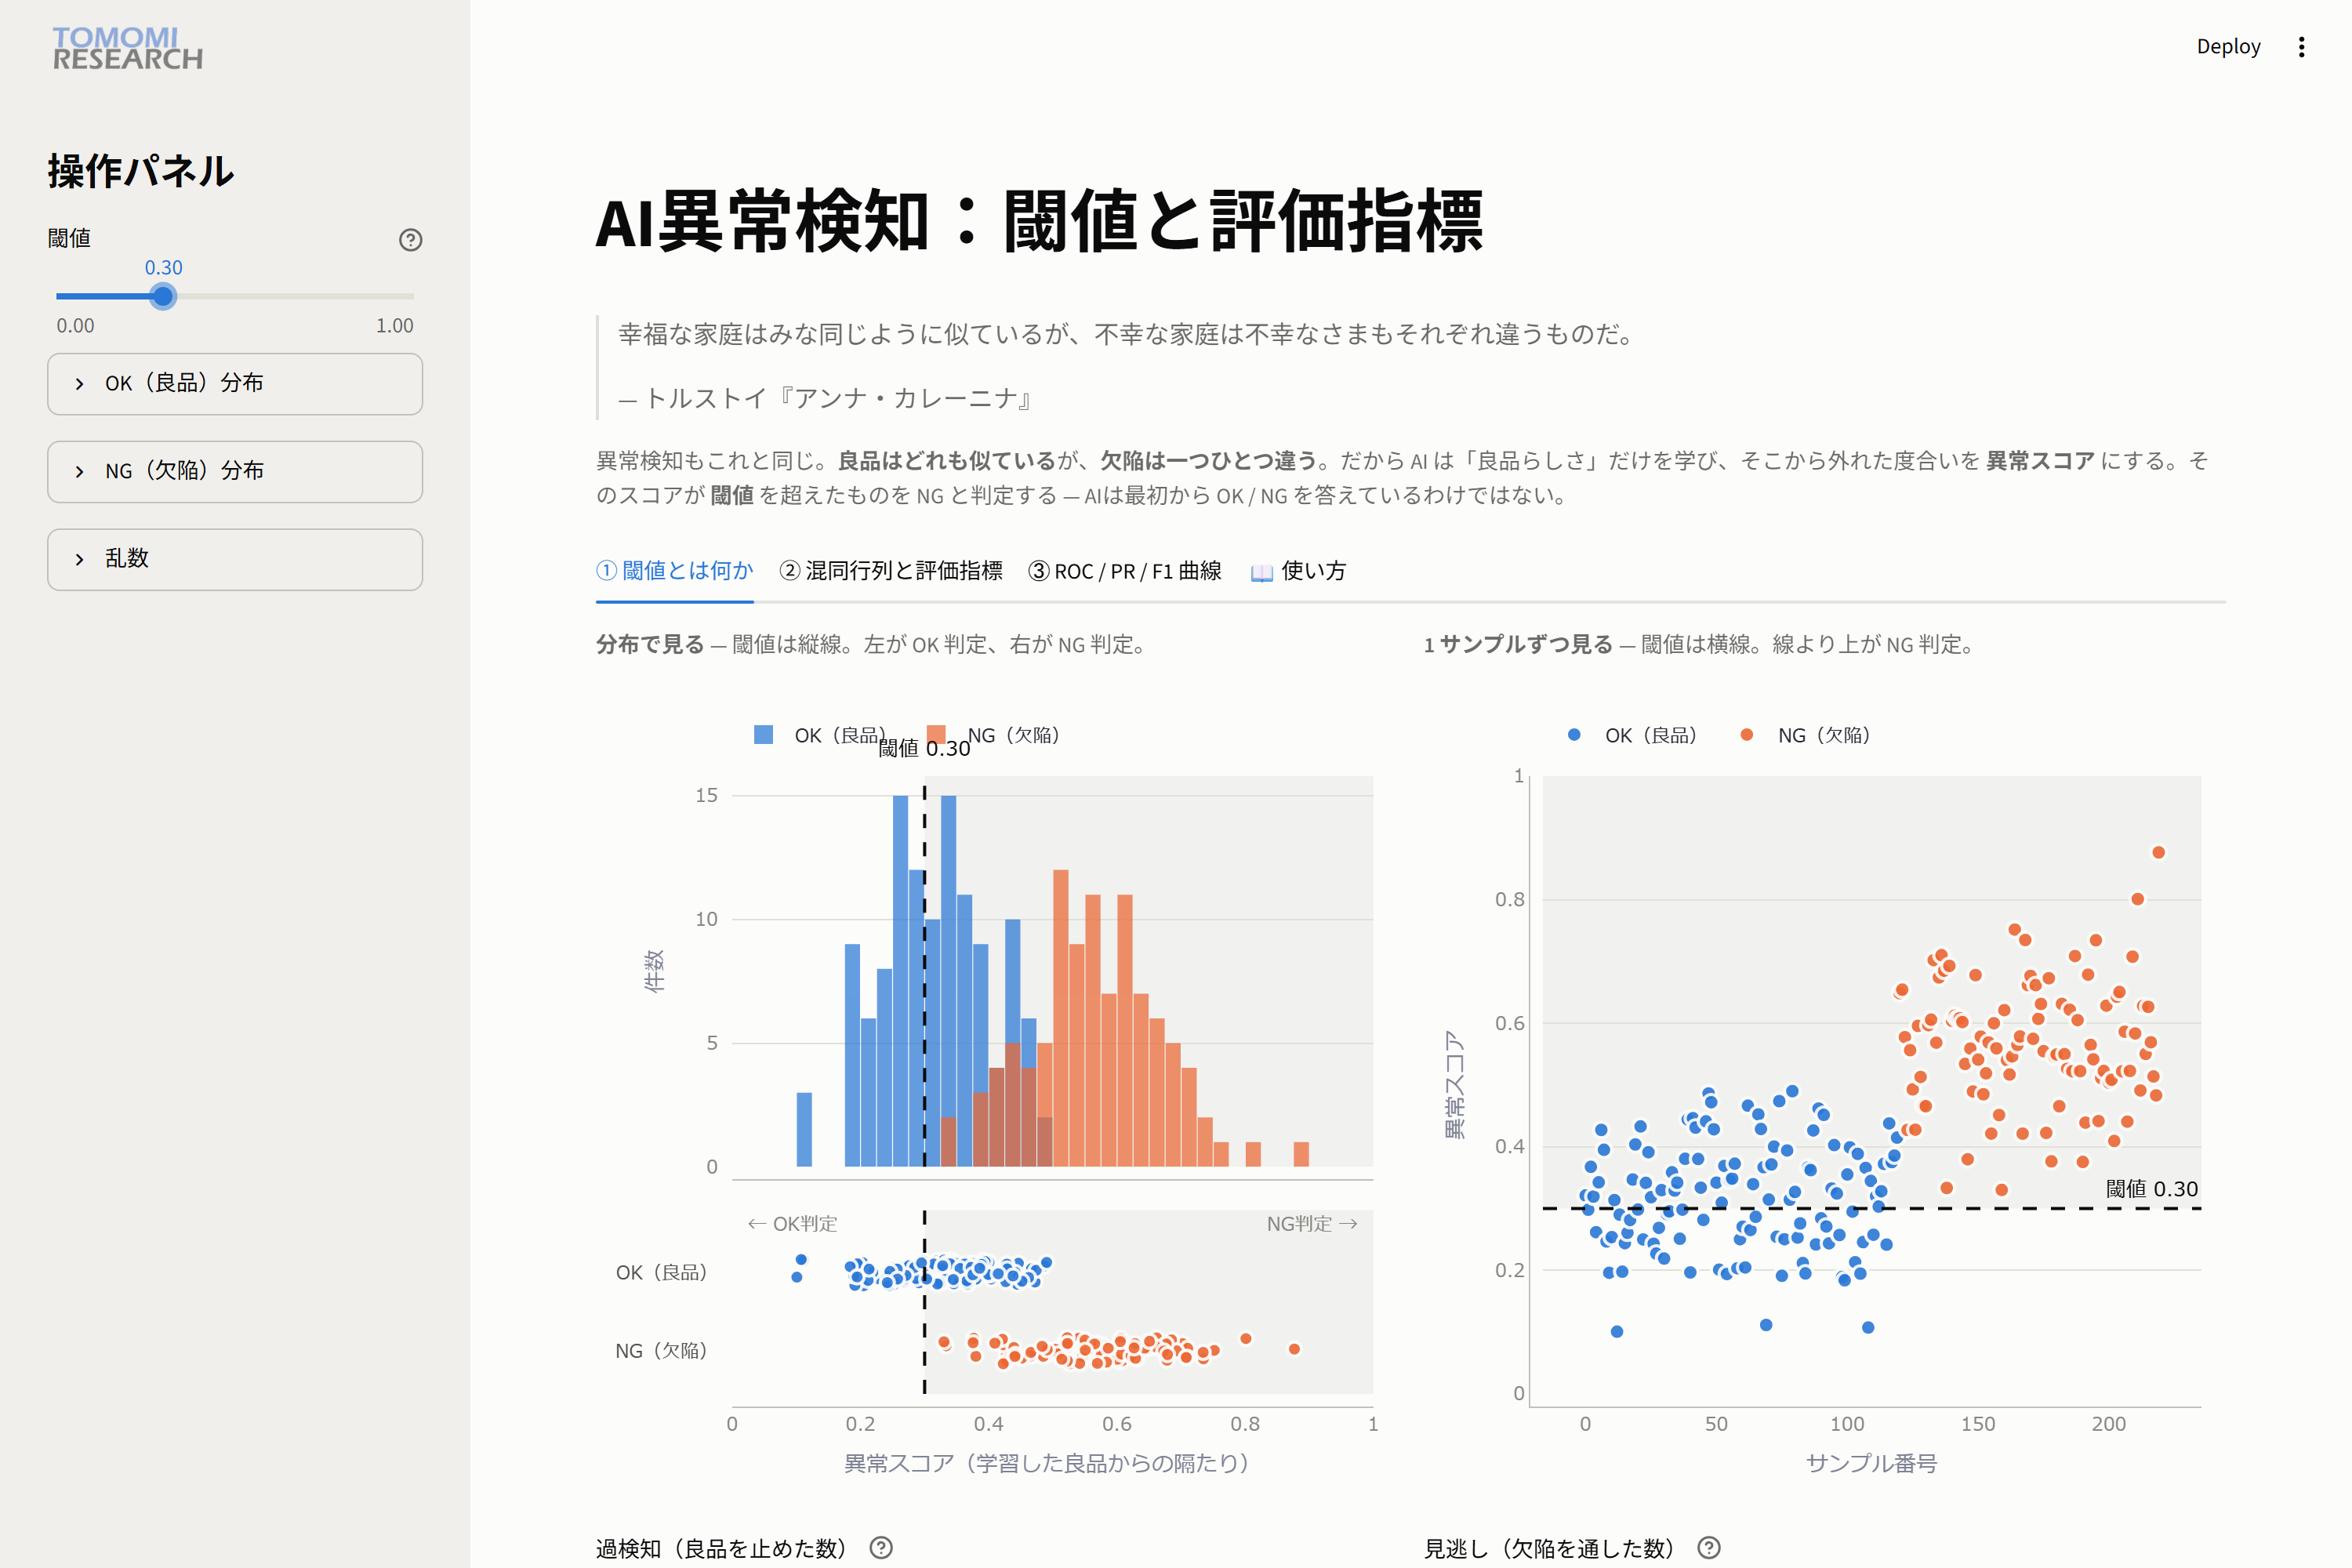
👀 Observe: false detections jump to 67, and missed defects drop to 0.
Moving the line to the left catches every defect, but sweeps in a large number of good parts as well.
🖱 Try it 2: move the threshold to the right (higher)
Now raise it to around 0.60.
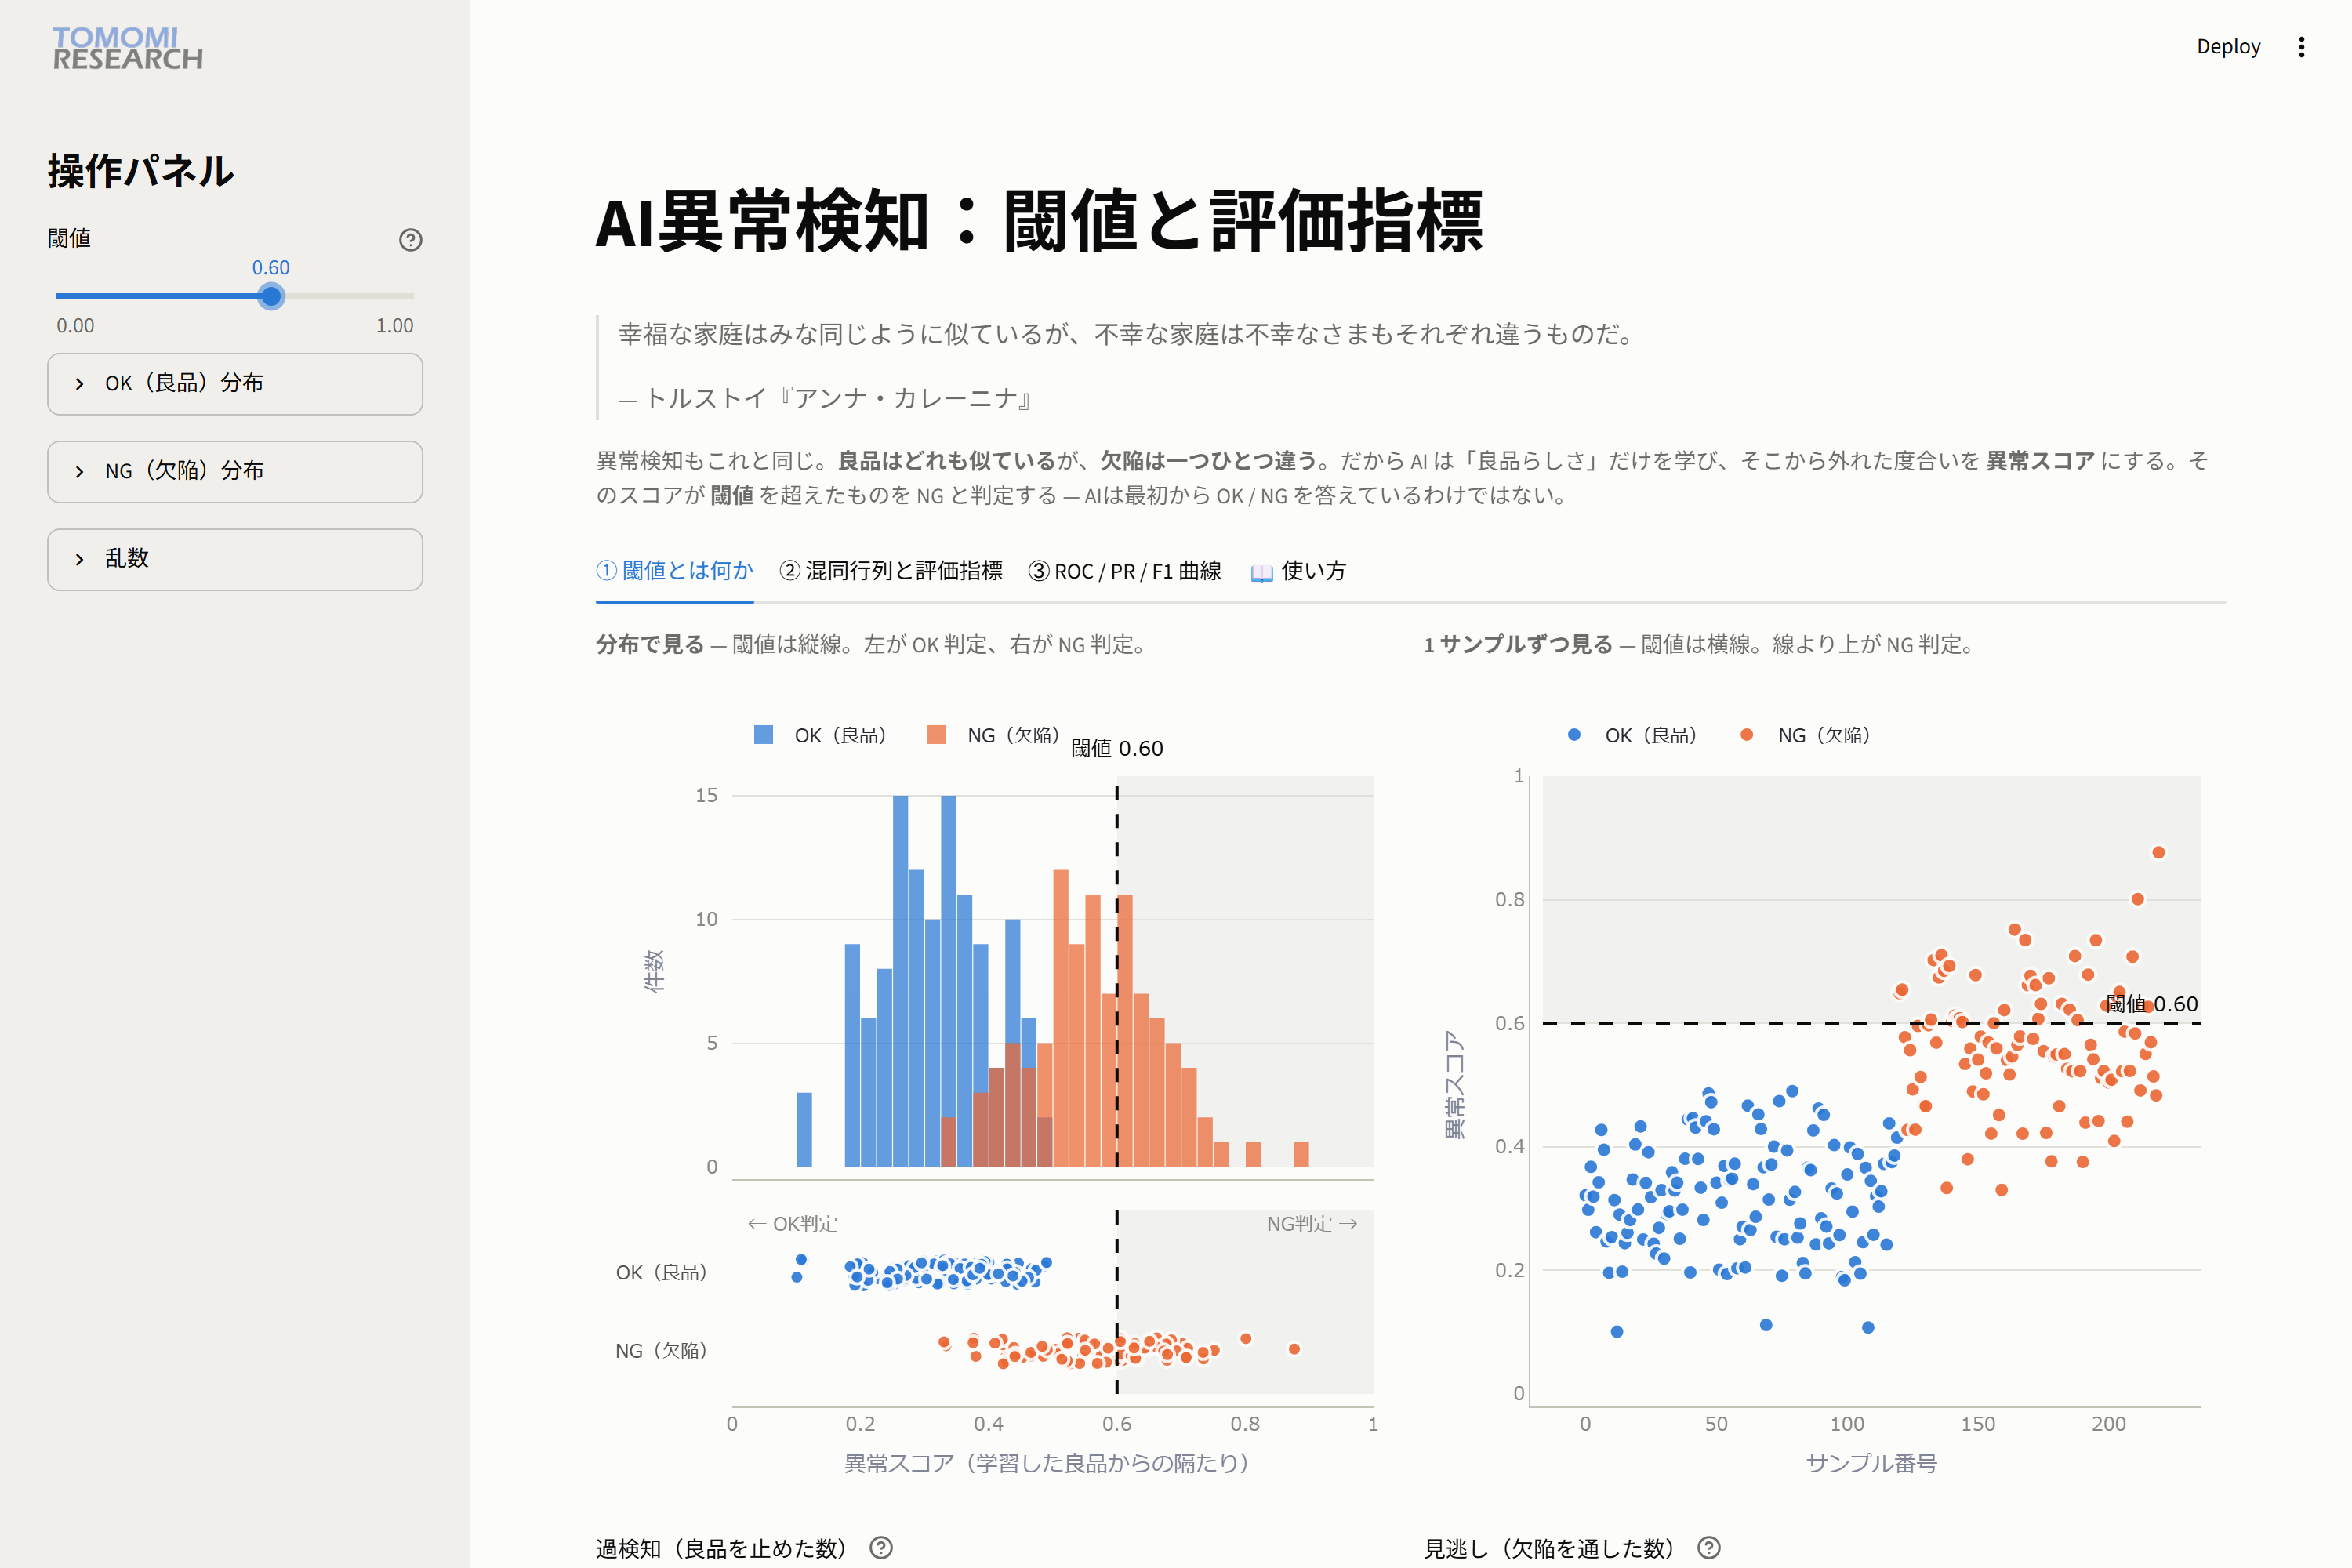
👀 Observe: false detections are 0, but missed defects rise to 62.
Moving the line to the right lets good parts pass, but lets a large share of defects slip through.
🖱 Try it 3: return to the balance point (0.44)
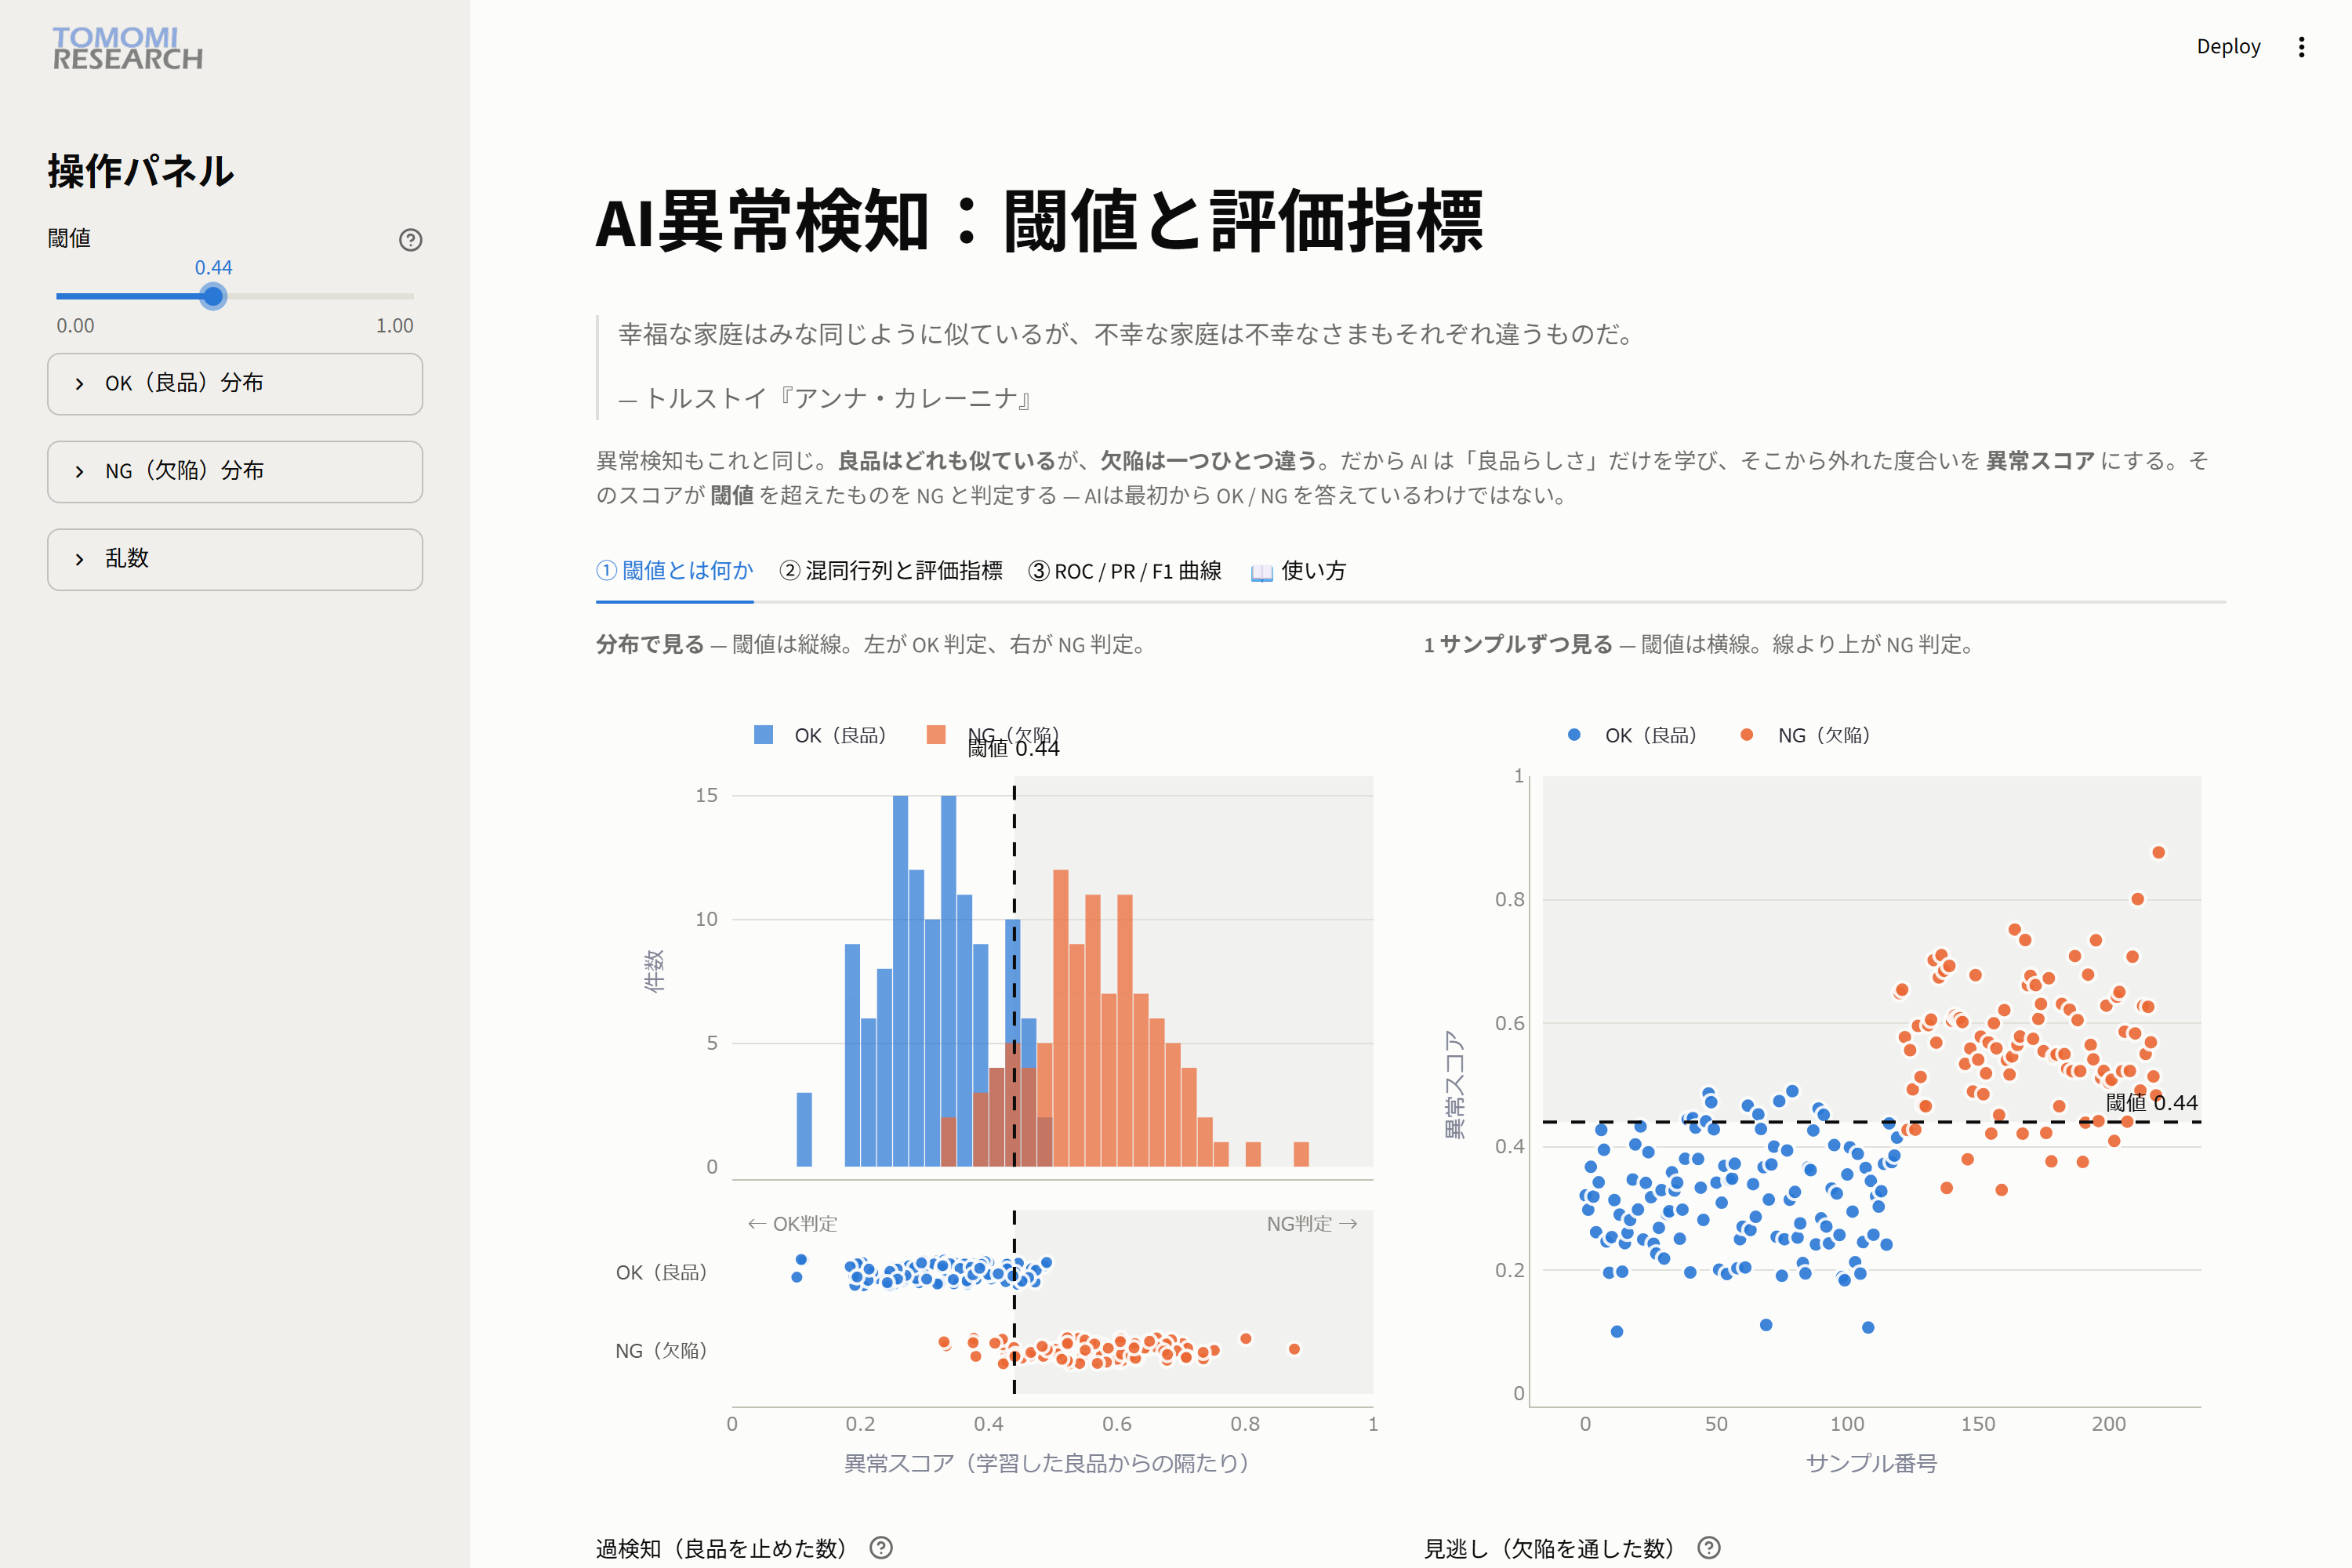
👀 Observe: 11 false detections and 12 missed defects. This is the balance point where both are low.
The key point of this part
| Threshold | False detections | Missed defects |
|---|---|---|
| Low (0.30) | 67 | 0 |
| Middle (0.44) | 11 | 12 |
| High (0.60) | 0 | 62 |
No threshold can bring false detections and missed defects to zero at the same time (because the distributions overlap).
Reduce one, and the other always increases. That is why the threshold is not a "mathematically correct answer."
It is an operating condition, decided by your quality policy: which do you want to avoid more, missed defects or false detections?
This is the first and most important intuition to grasp in evaluating anomaly detection.
