
A Hands-On Guide to Evaluating AI Anomaly Detection (2/4)
 kotai2003
A tutorial for getting a feel for thresholds, the confusion matrix, and ROC/PR/F1 curves by moving sliders
When companies introduce AI visual inspection, the part most often misunderstood is "evaluation."
You may be told, "We will set the threshold where F1 is highest," but what is F1, why does the threshold change the results,
and how far can you trust a figure like 100%? Discussions often move ahead before these points really sink in.
In this article, you will operate a browser-based learning app as you read, building a hands-on understanding of the evaluation process for anomaly detection
one step at a time. No formulas to memorize. Just move the sliders
and watch the numbers and graphs move together, and you will grasp the overall picture of evaluation.
App (free, no installation required)
https://anomalydetectiondemo.streamlit.app/We recommend opening this article in a separate window and reading it while you operate the app.
All data shown is simulated data for explanation purposes, not data from real products.
What you will learn in this tutorial
- The relationship between the anomaly score and the threshold, and the trade-off between "false detections and missed defects"
- What the confusion matrix and the five evaluation metrics (Recall / Precision / F1 and others) represent
- How to read ROC / PR / F1 curves, and five ways to set the threshold
- An evaluation pitfall: "Even the same AI gets different scores depending on the sample"
Each part includes 🖱 Try it and 👀 Observe steps. Please try them yourself.
https://www.tomomi-research.com/en/archives/7726
Part 2. The confusion matrix and evaluation metrics: four boxes and five scores (Tab 2)
Tab 2 summarizes the results you saw in Tab 1 as a table and a scorecard. Click Tab 2 at the top.
The confusion matrix (four boxes)
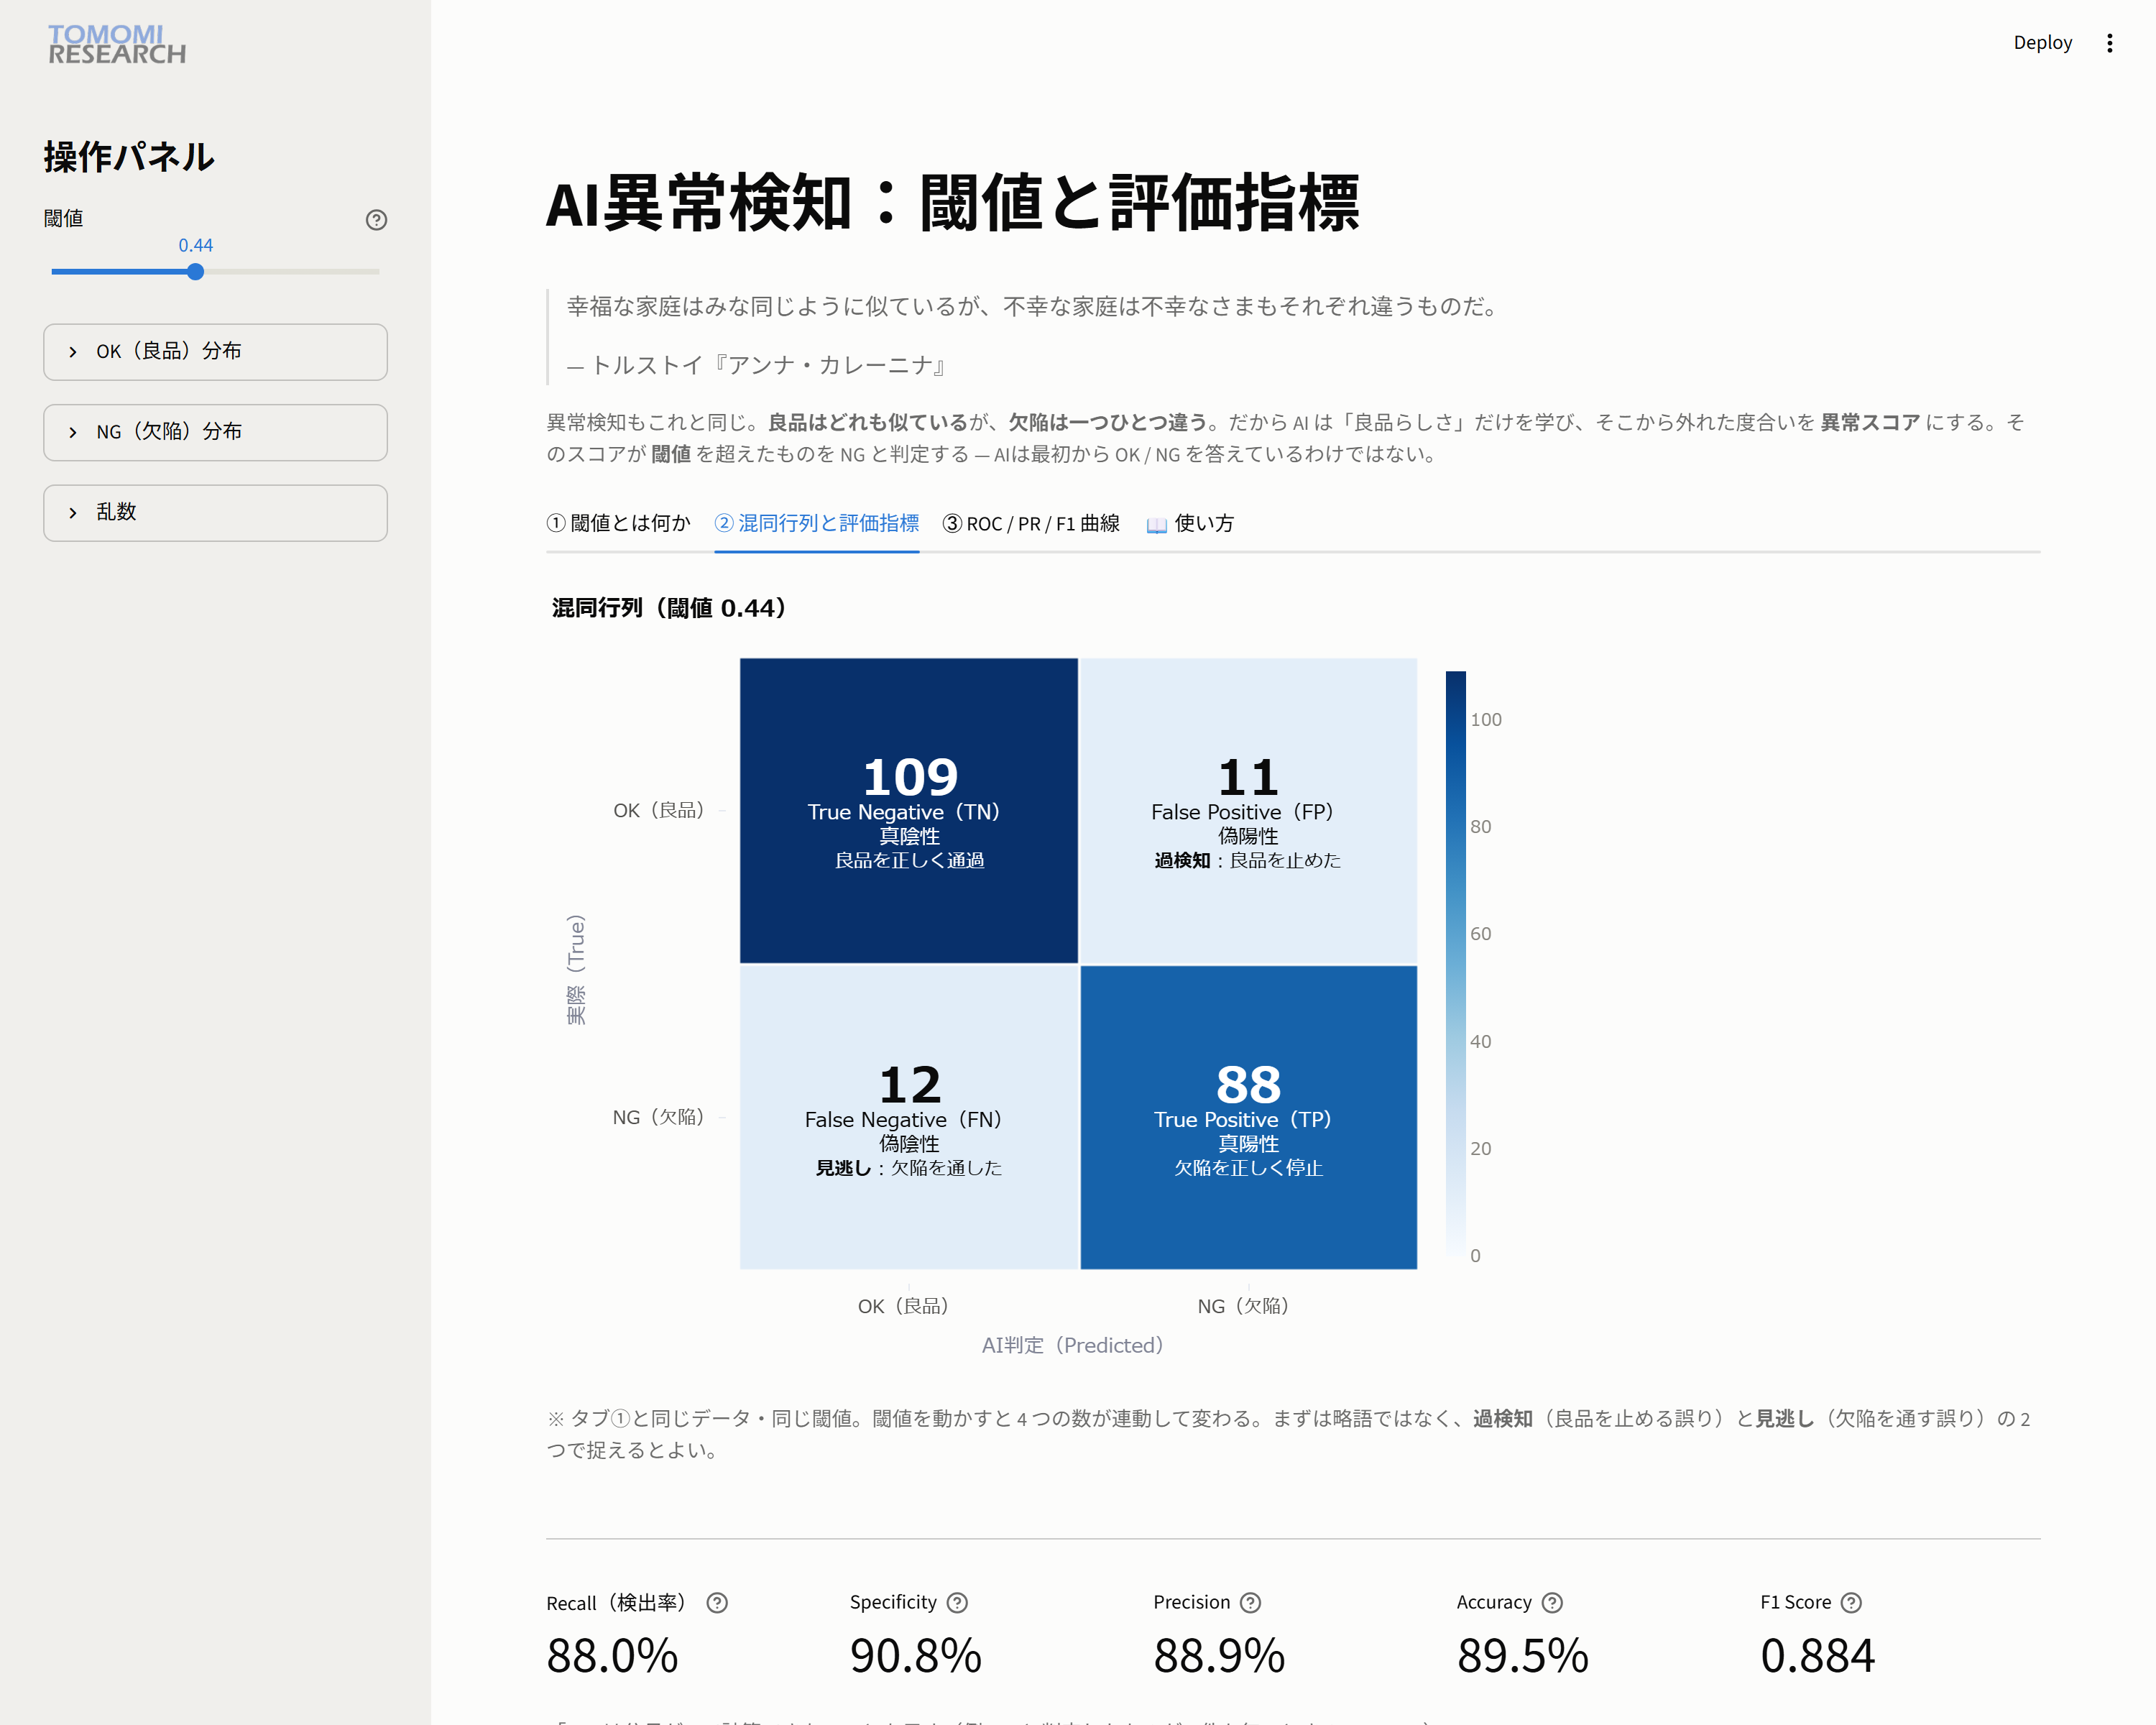
Every judgment falls into one of the following four boxes. A darker box simply means a larger count.
| AI: judged OK | AI: judged NG | |
|---|---|---|
| Actual: good part | TN (correctly passed) 109 | FP = false detection 11 |
| Actual: defect | FN = missed defect 12 | TP (correctly stopped) 88 |
To start, you only need to remember two: FP = false detection and FN = missed defect
(TN and TP are the "correct answers," so they can wait).
The five evaluation metrics
Scroll down a little and a scorecard appears.
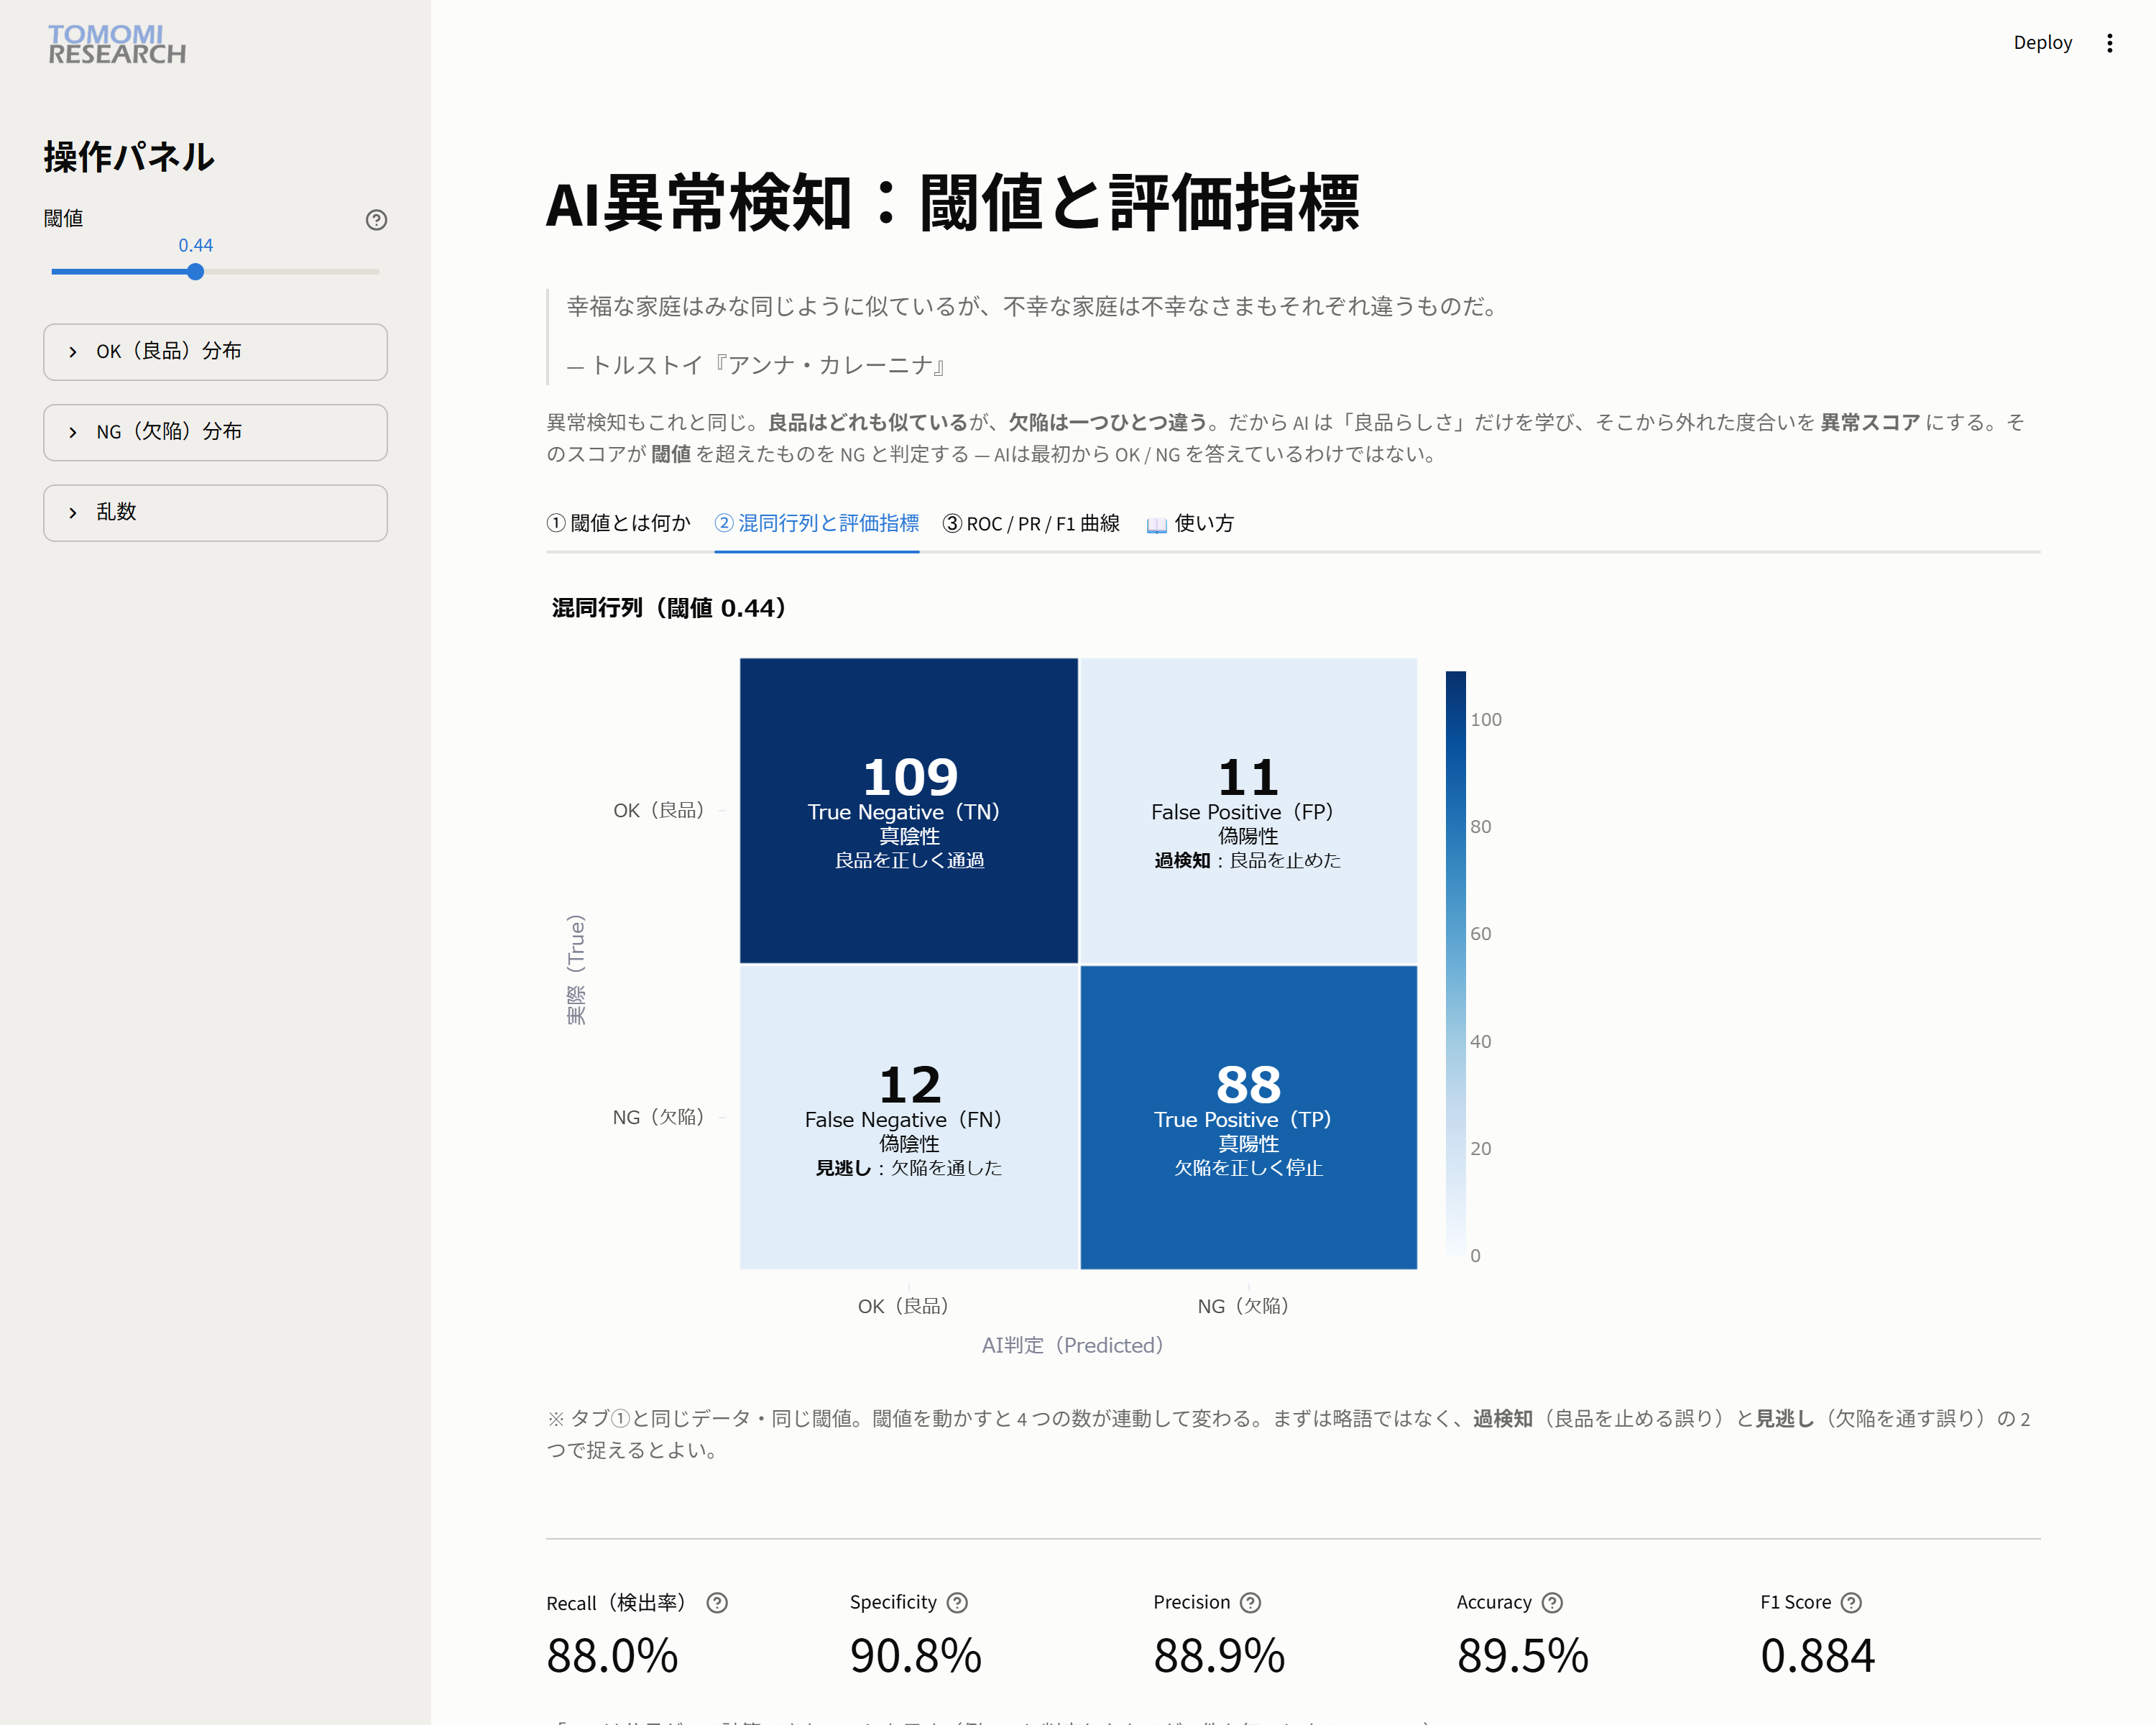
The names may sound difficult, but the meanings are simple.
| Metric | Rough meaning | This example |
|---|---|---|
| Recall (detection rate) | What % of defects were caught | 88.0% |
| Specificity | What % of good parts were correctly passed | 90.8% |
| Precision | Of the items called "NG," what % were actually defects | 88.9% |
| Accuracy | Of all items, what % were judged correctly | 89.5% |
| F1 Score | A balance score between Recall and Precision | 0.884 |
🖱 Try it 4: move the threshold and see everything "move together"
Move the threshold slider in the sidebar.
The four boxes and the five metrics all move at once.
This is the key point of evaluation. The confusion matrix and every evaluation metric are all calculated from "the same four numbers."
That is why moving a single threshold changes the entire scorecard together.
💡 A metric may sometimes show "—". This means "the denominator is 0, so it cannot be calculated,"
not "the score was 0" (for example, if nothing is judged NG, Precision cannot be calculated).

