
A Hands-On Guide to Evaluating AI Anomaly Detection (3/4)
 kotai2003
A tutorial for getting a feel for thresholds, the confusion matrix, and ROC/PR/F1 curves by moving sliders
When companies introduce AI visual inspection, the part most often misunderstood is "evaluation."
You may be told, "We will set the threshold where F1 is highest," but what is F1, why does the threshold change the results,
and how far can you trust a figure like 100%? Discussions often move ahead before these points really sink in.
In this article, you will operate a browser-based learning app as you read, building a hands-on understanding of the evaluation process for anomaly detection
one step at a time. No formulas to memorize. Just move the sliders
and watch the numbers and graphs move together, and you will grasp the overall picture of evaluation.
App (free, no installation required)
https://anomalydetectiondemo.streamlit.app/We recommend opening this article in a separate window and reading it while you operate the app.
All data shown is simulated data for explanation purposes, not data from real products.
What you will learn in this tutorial
- The relationship between the anomaly score and the threshold, and the trade-off between "false detections and missed defects"
- What the confusion matrix and the five evaluation metrics (Recall / Precision / F1 and others) represent
- How to read ROC / PR / F1 curves, and five ways to set the threshold
- An evaluation pitfall: "Even the same AI gets different scores depending on the sample"
Each part includes 🖱 Try it and 👀 Observe steps. Please try them yourself.
Part 3. Evaluation curves and "how to set the threshold" (Tab 3)
So far, you have moved the threshold by hand. In Tab 3,
you choose a policy for "how to set" the threshold and compare the results in graphs. Click Tab 3.
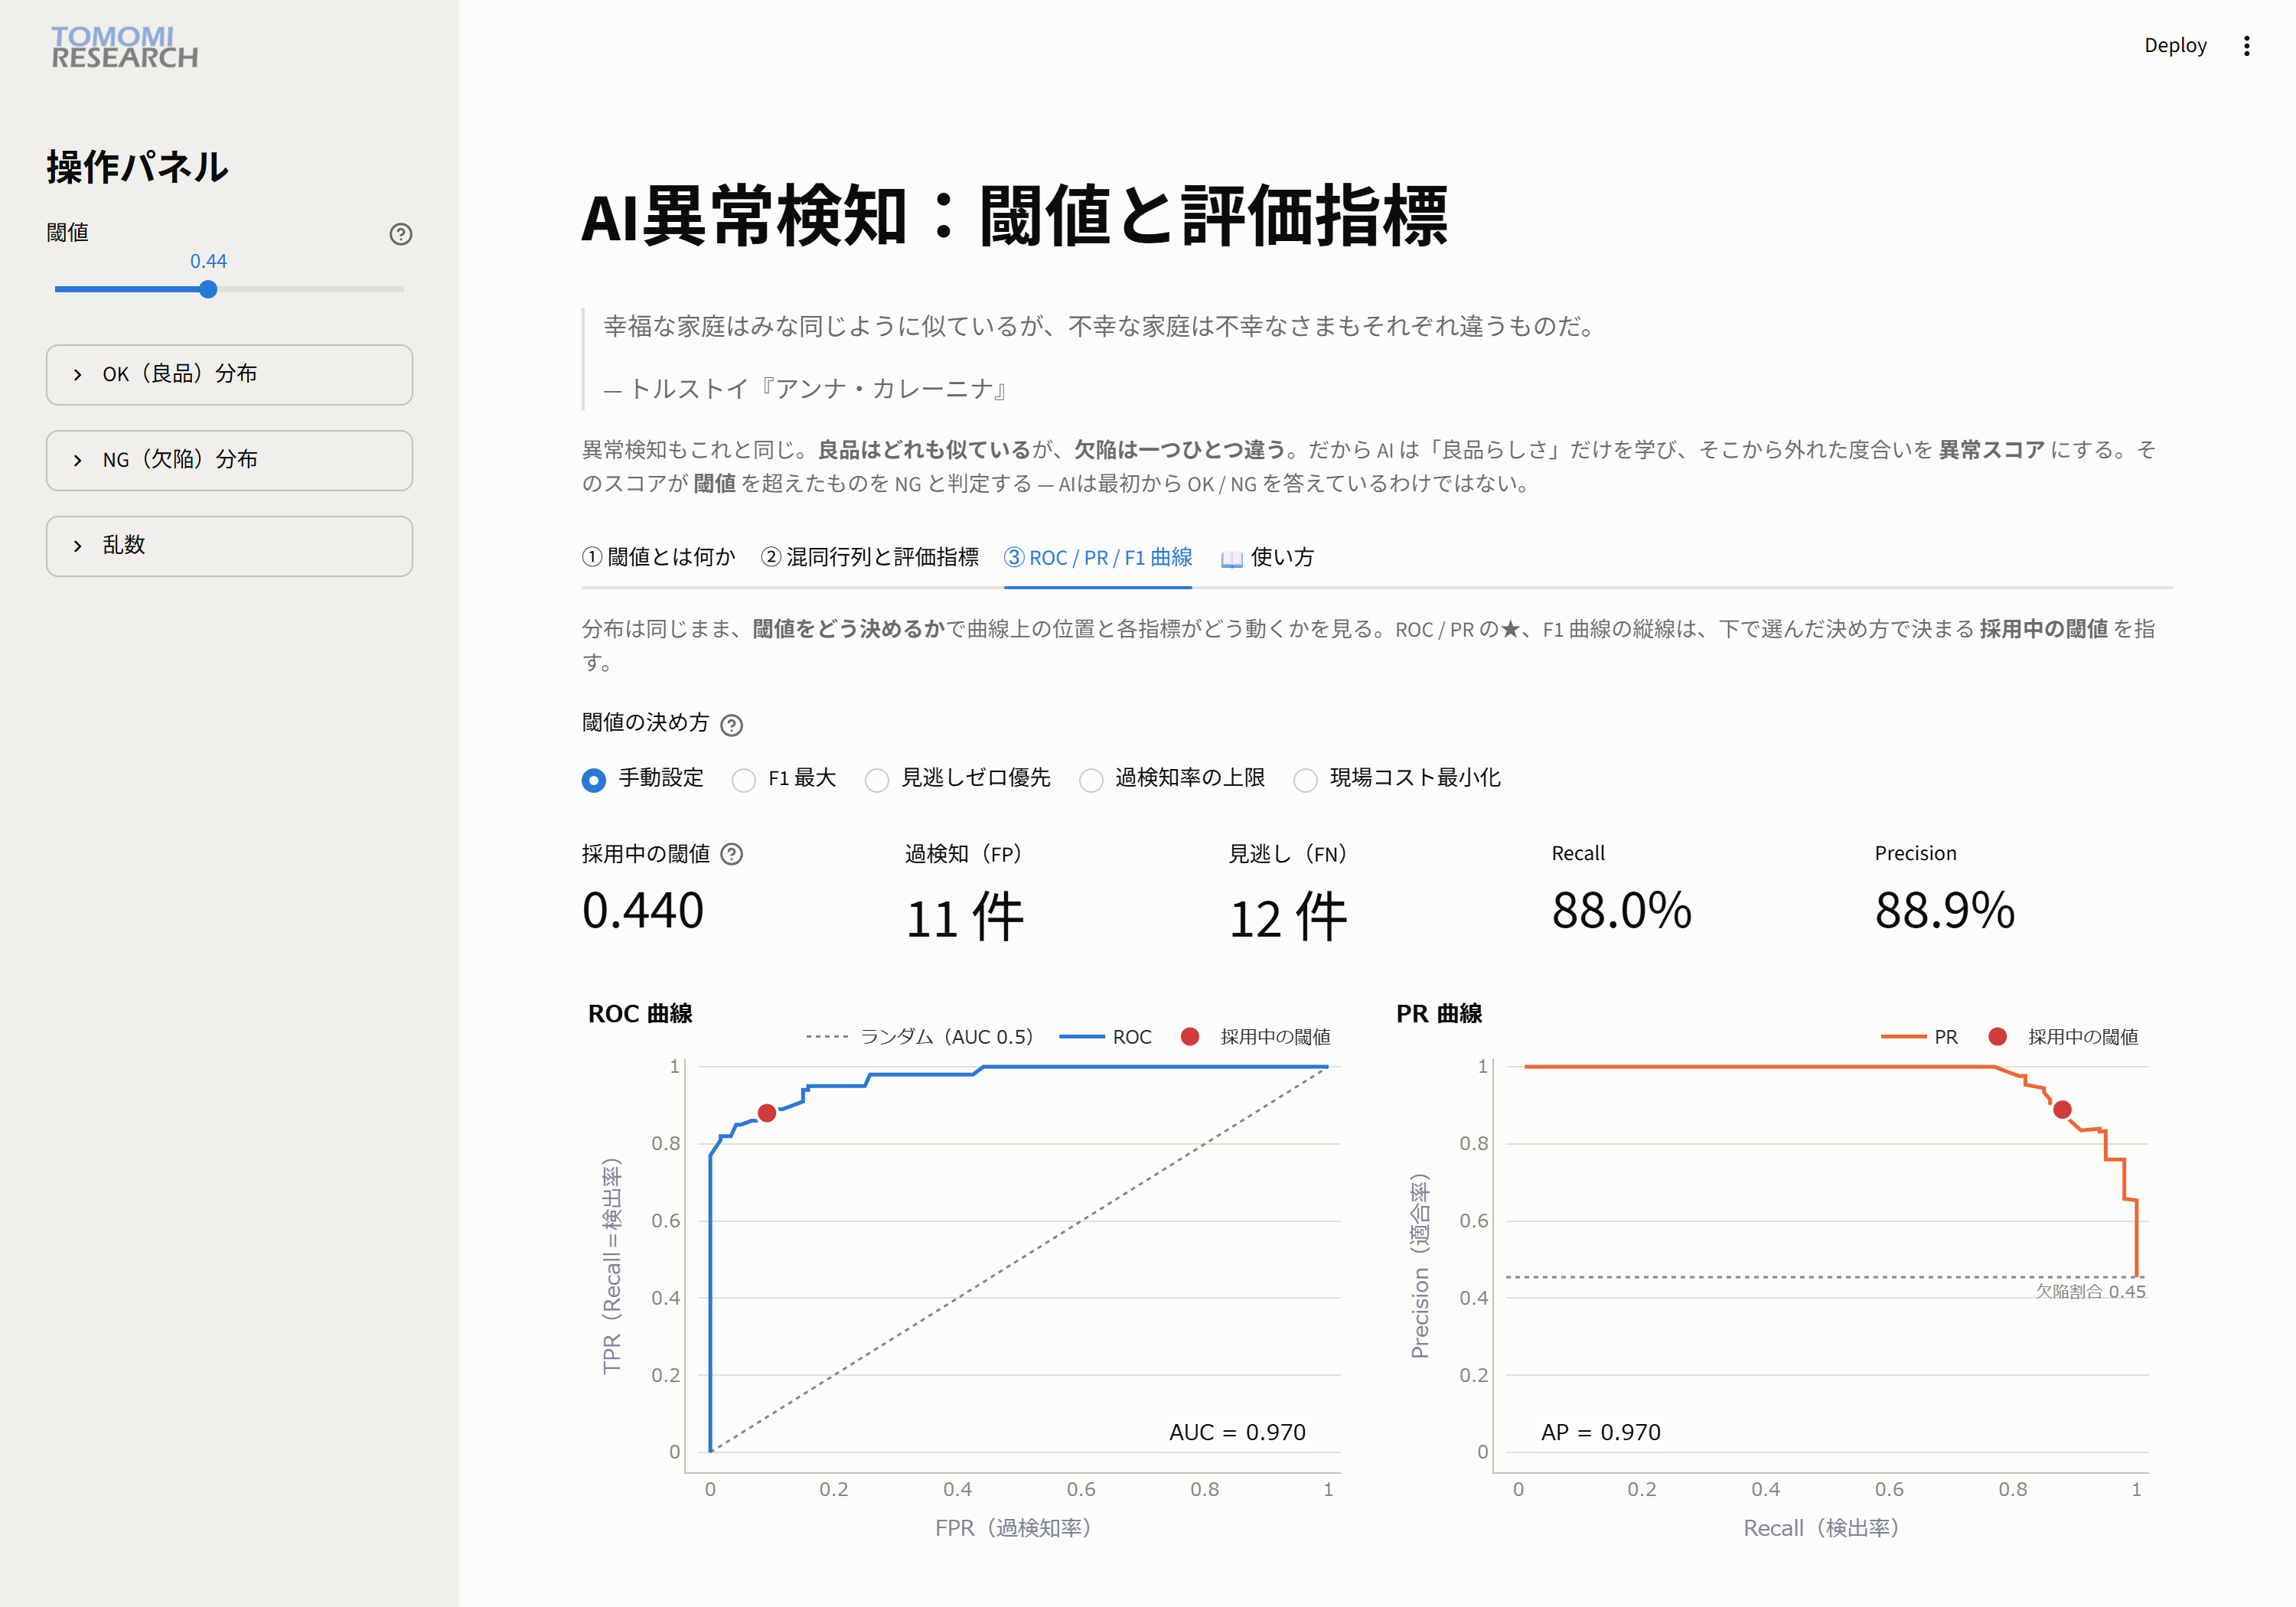
First, the ROC curve: the capability of the detector itself
- The horizontal axis is FPR (false detection rate); the vertical axis is TPR (Recall). The closer the curve gets to the top left, the better.
- AUC (the area under the curve) is the capability of the detector. The closer to 1, the better; in this example it is 0.970.
- The important point is that AUC does not depend on the threshold. AUC reflects "how scores are assigned (that is, the AI's capability)" itself,
while the threshold is an operational choice about "how to use that capability."
The red dot marks the position of "the threshold currently in use." Change the method, and this dot moves along the curve.
Trying five ways to set the threshold
Switch the "threshold setting method" buttons and see how the numbers change.
1. F1 max
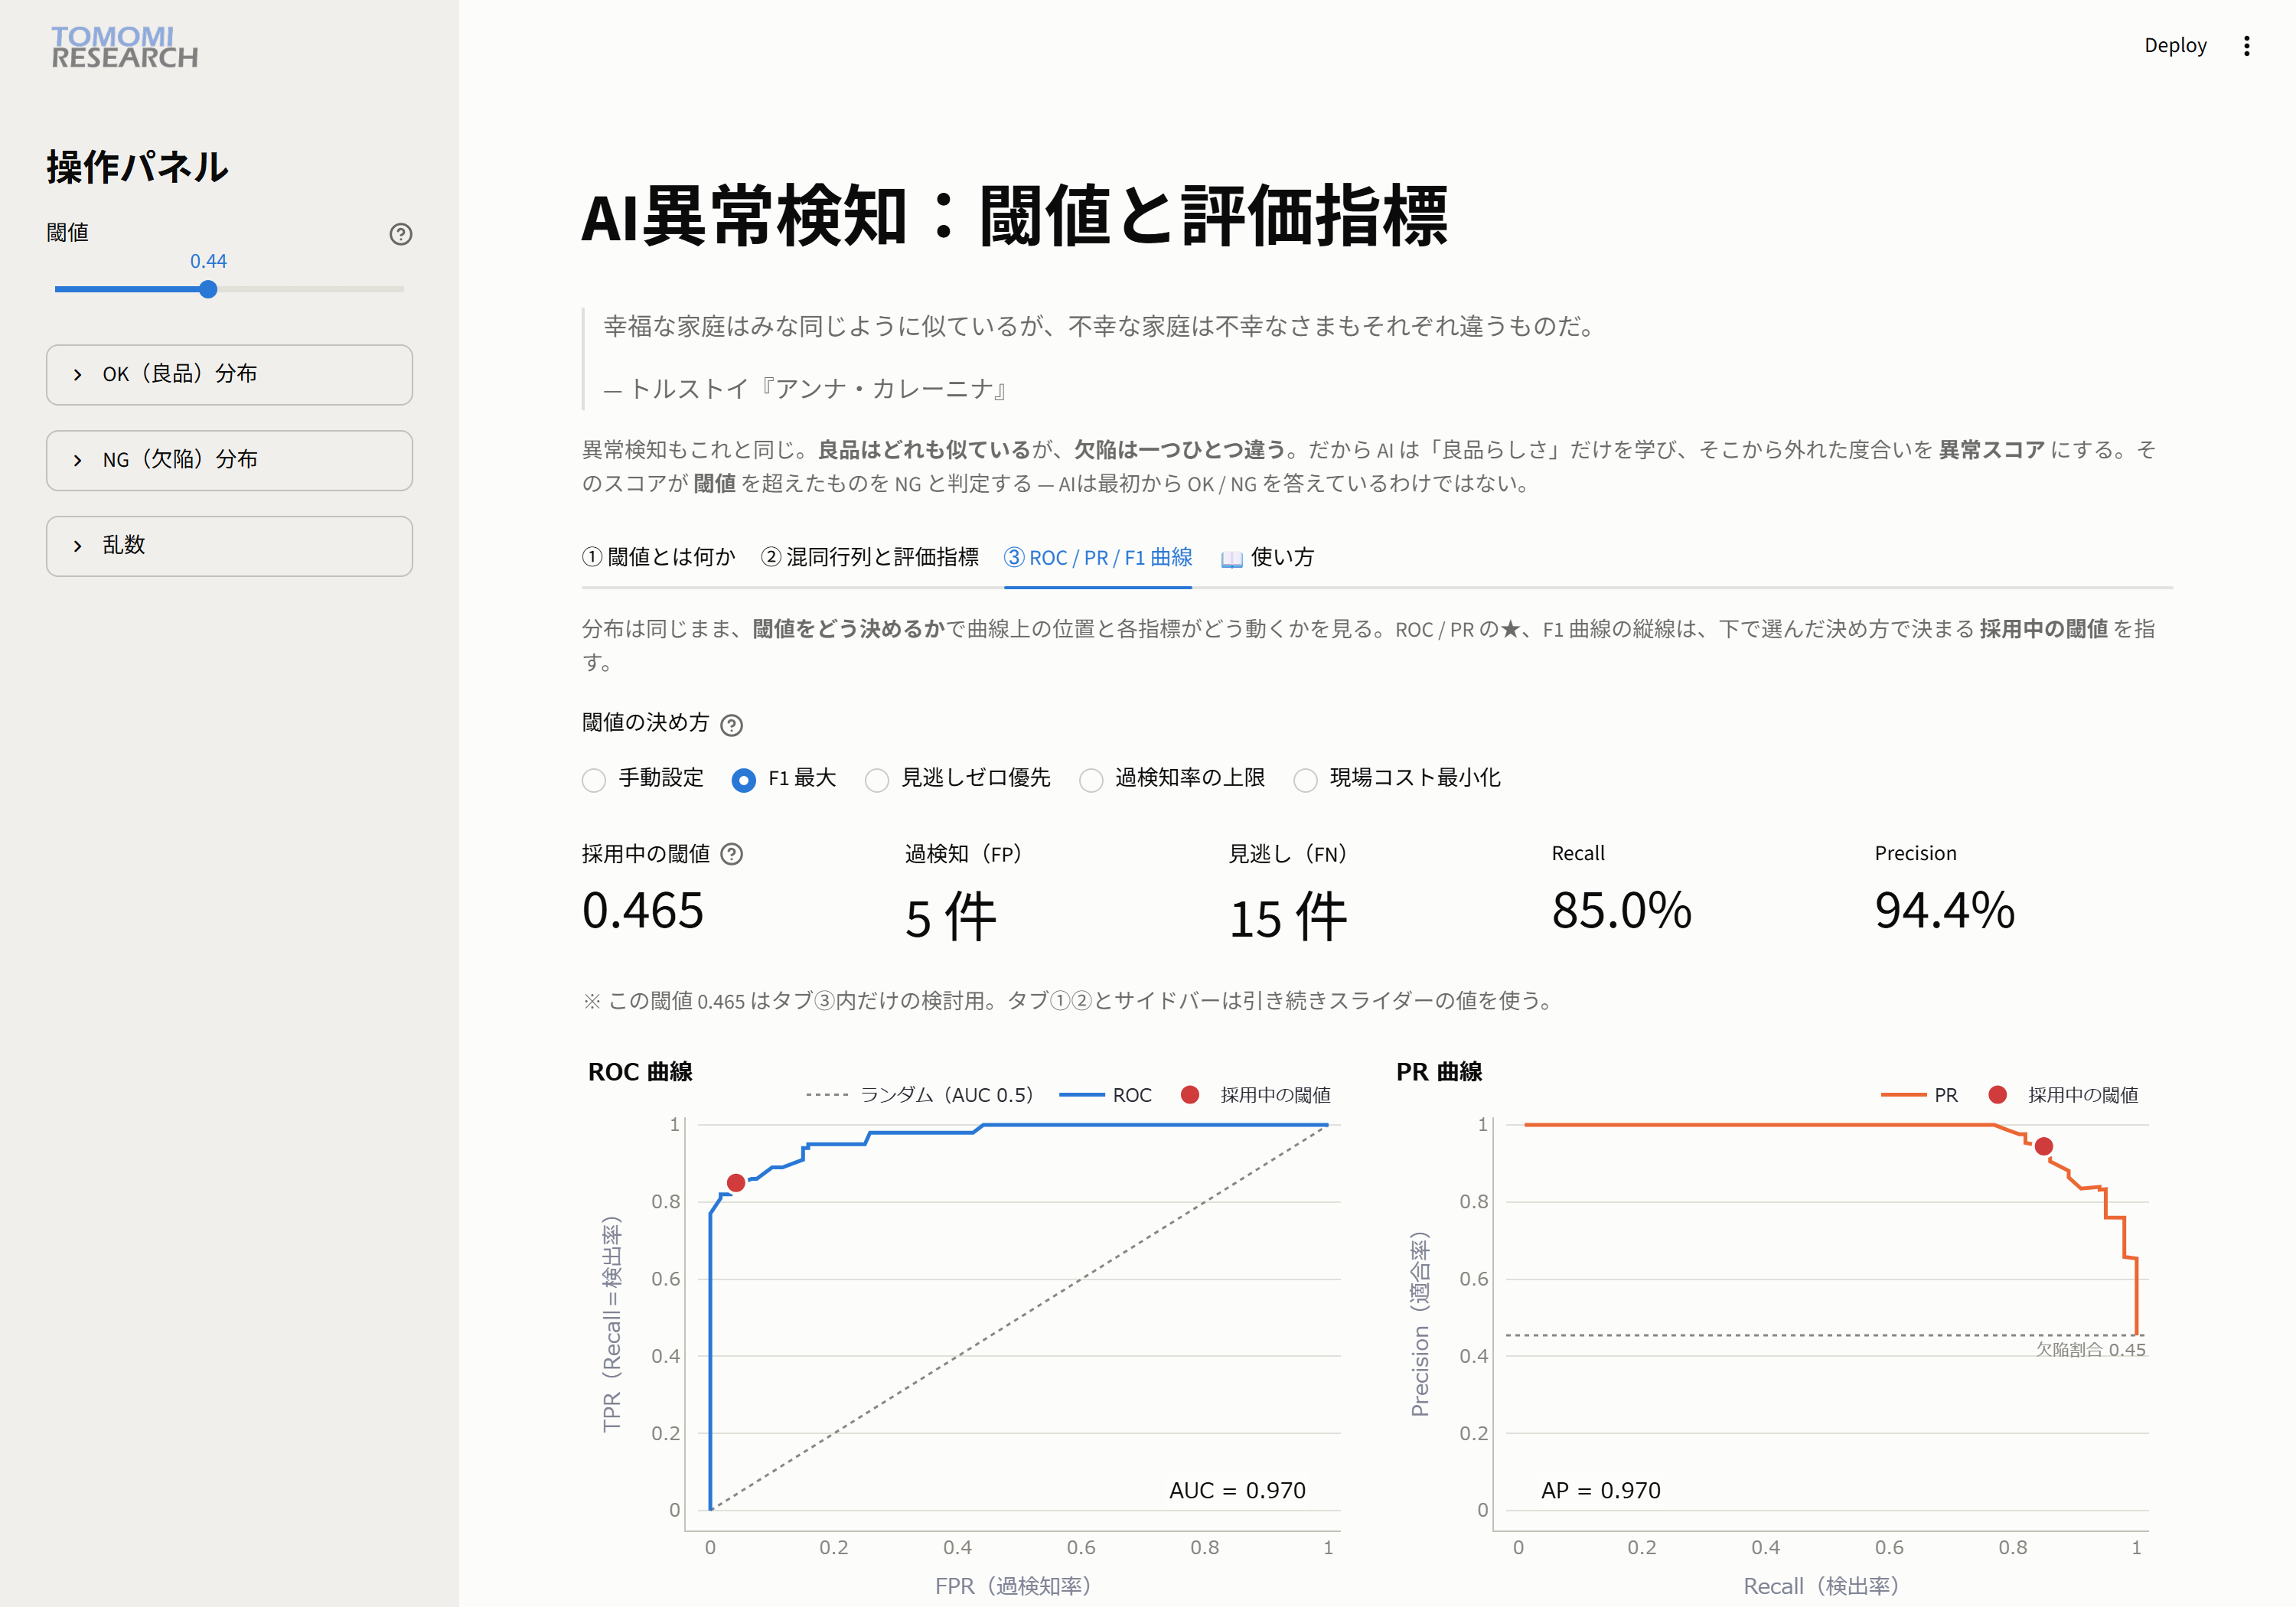
This automatically selects the threshold where F1 (the balance between Recall and Precision) is highest.
Mathematically it is a well-balanced point, but it is not necessarily the best choice on the shop floor.
2. Zero misses first
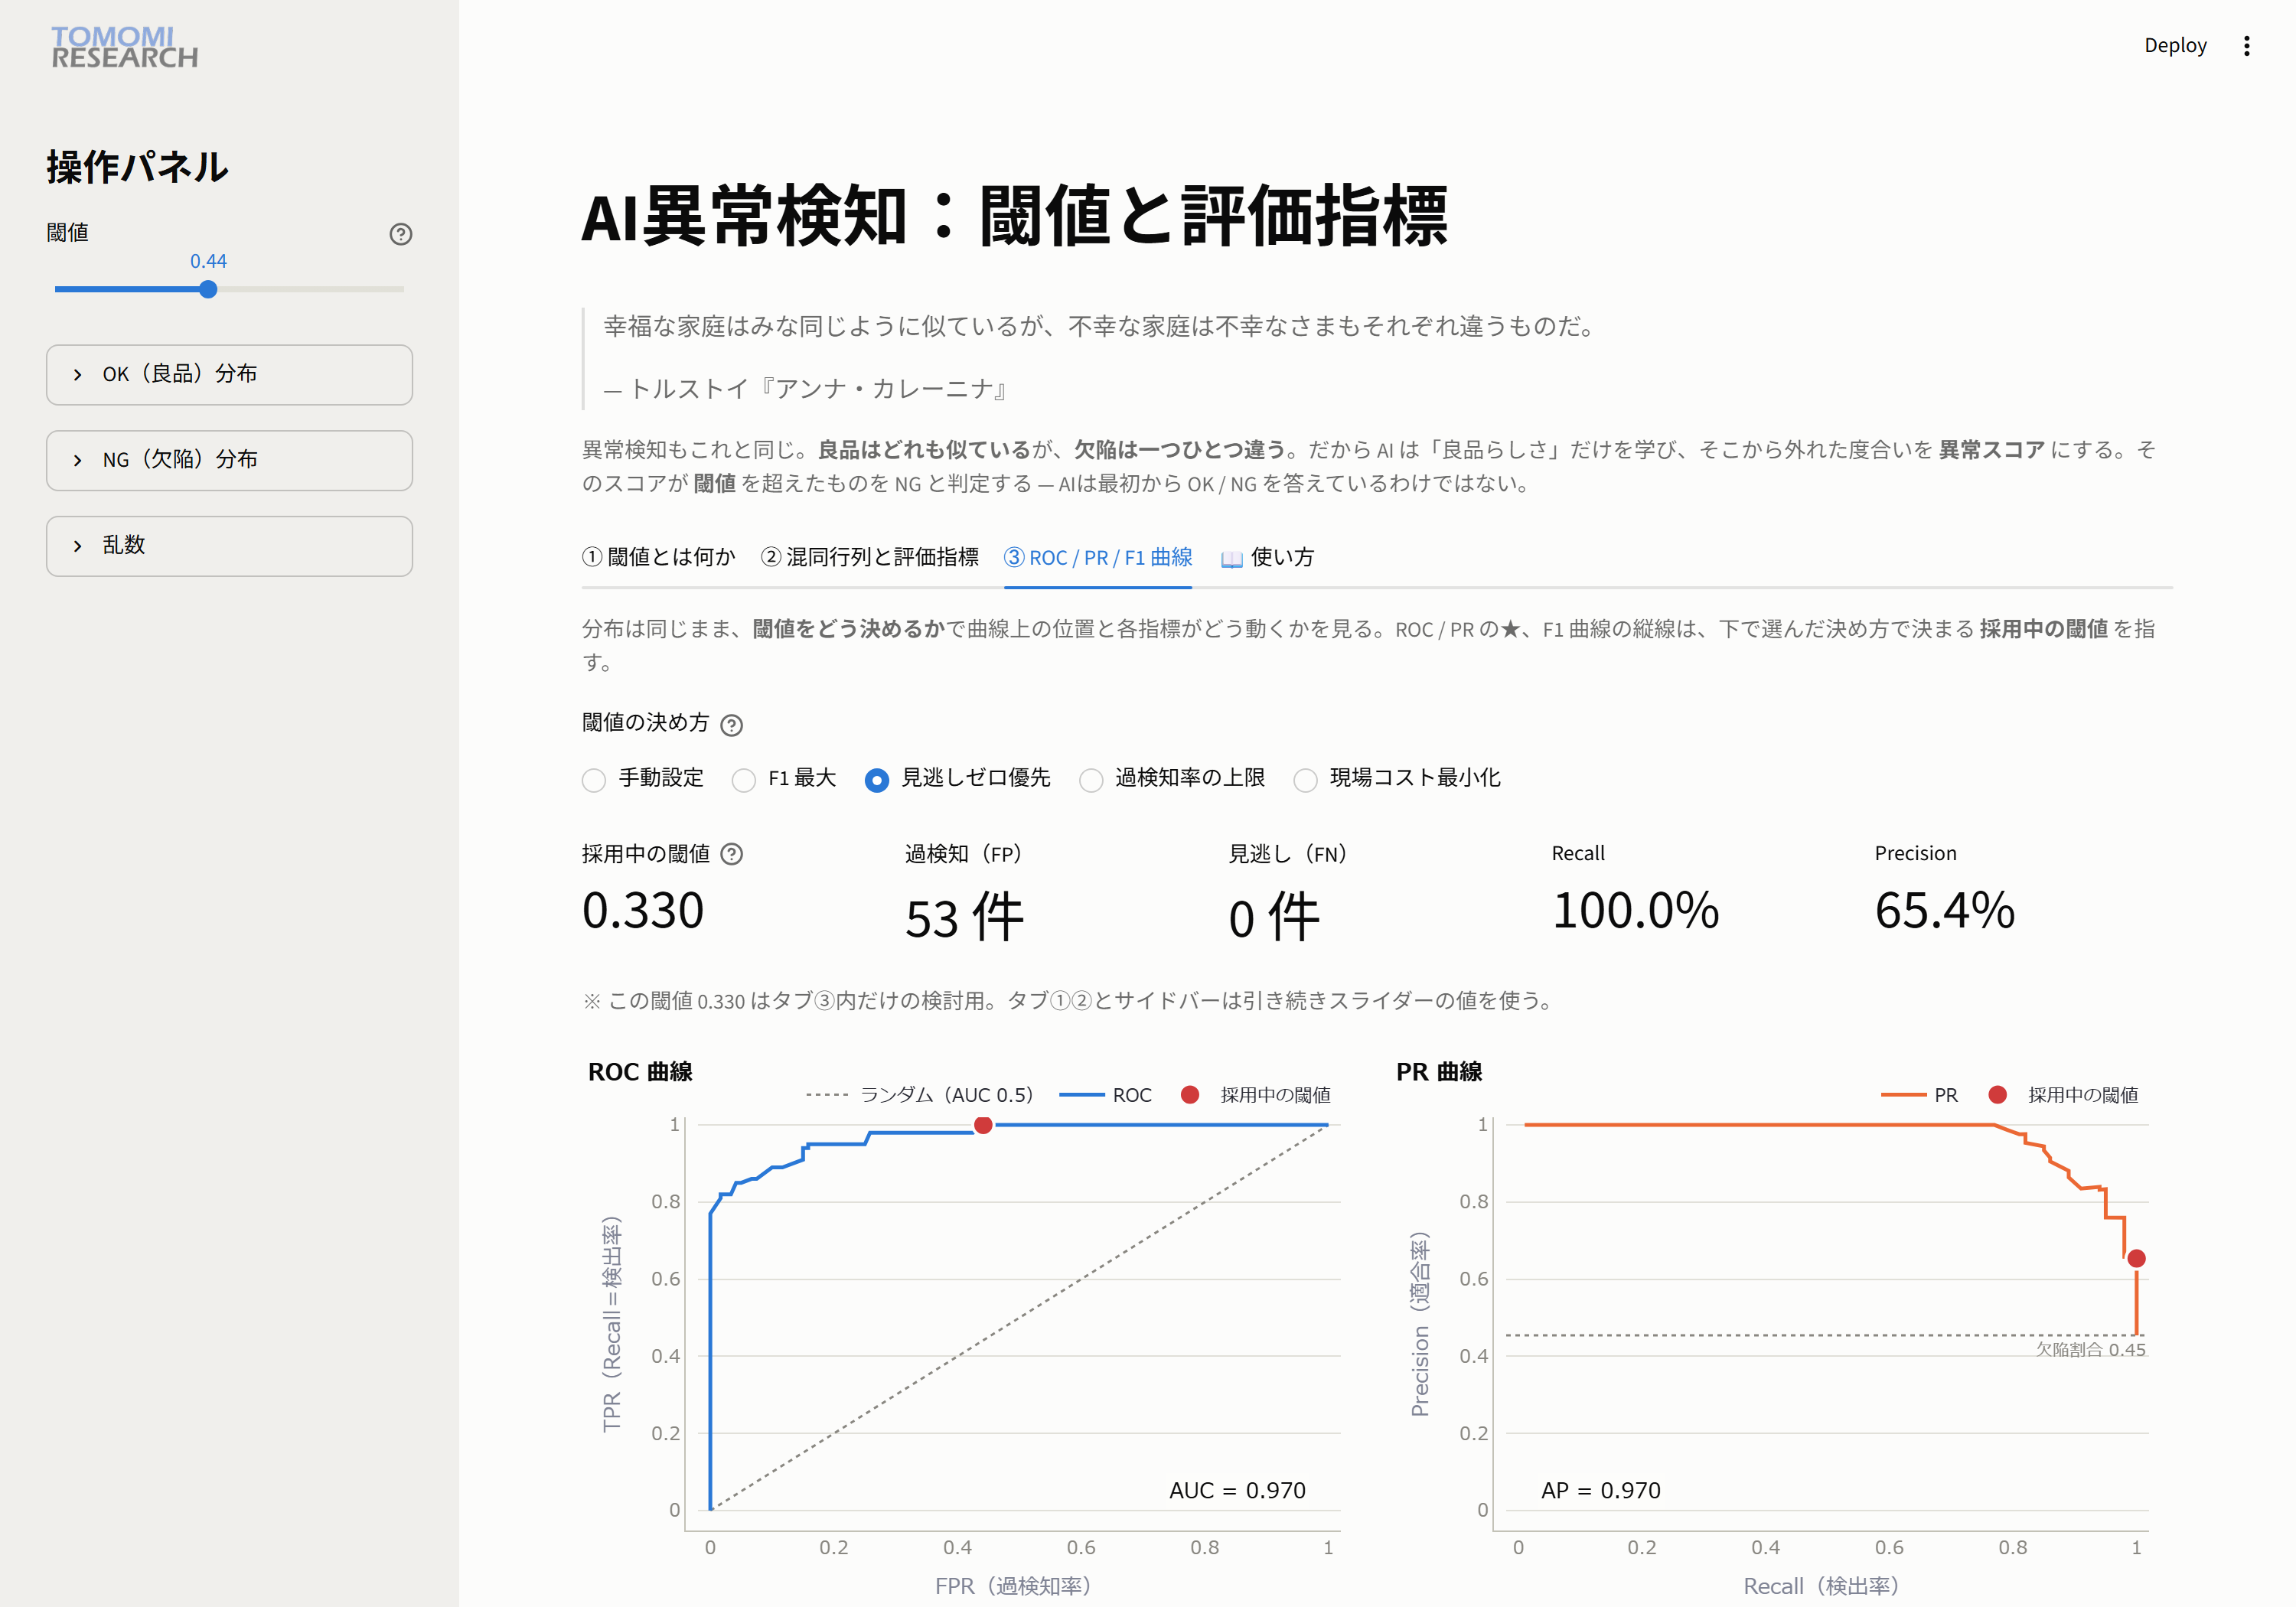
👀 Observe: threshold 0.330, 0 missed defects, Recall 100%.
The trade-off, however, is that false detections jump to 53 and Precision drops to 65.4%.
→ "Zero misses" sounds good, but it comes bundled with the cost of stopping too many good parts.
3. Cap on the false detection rate
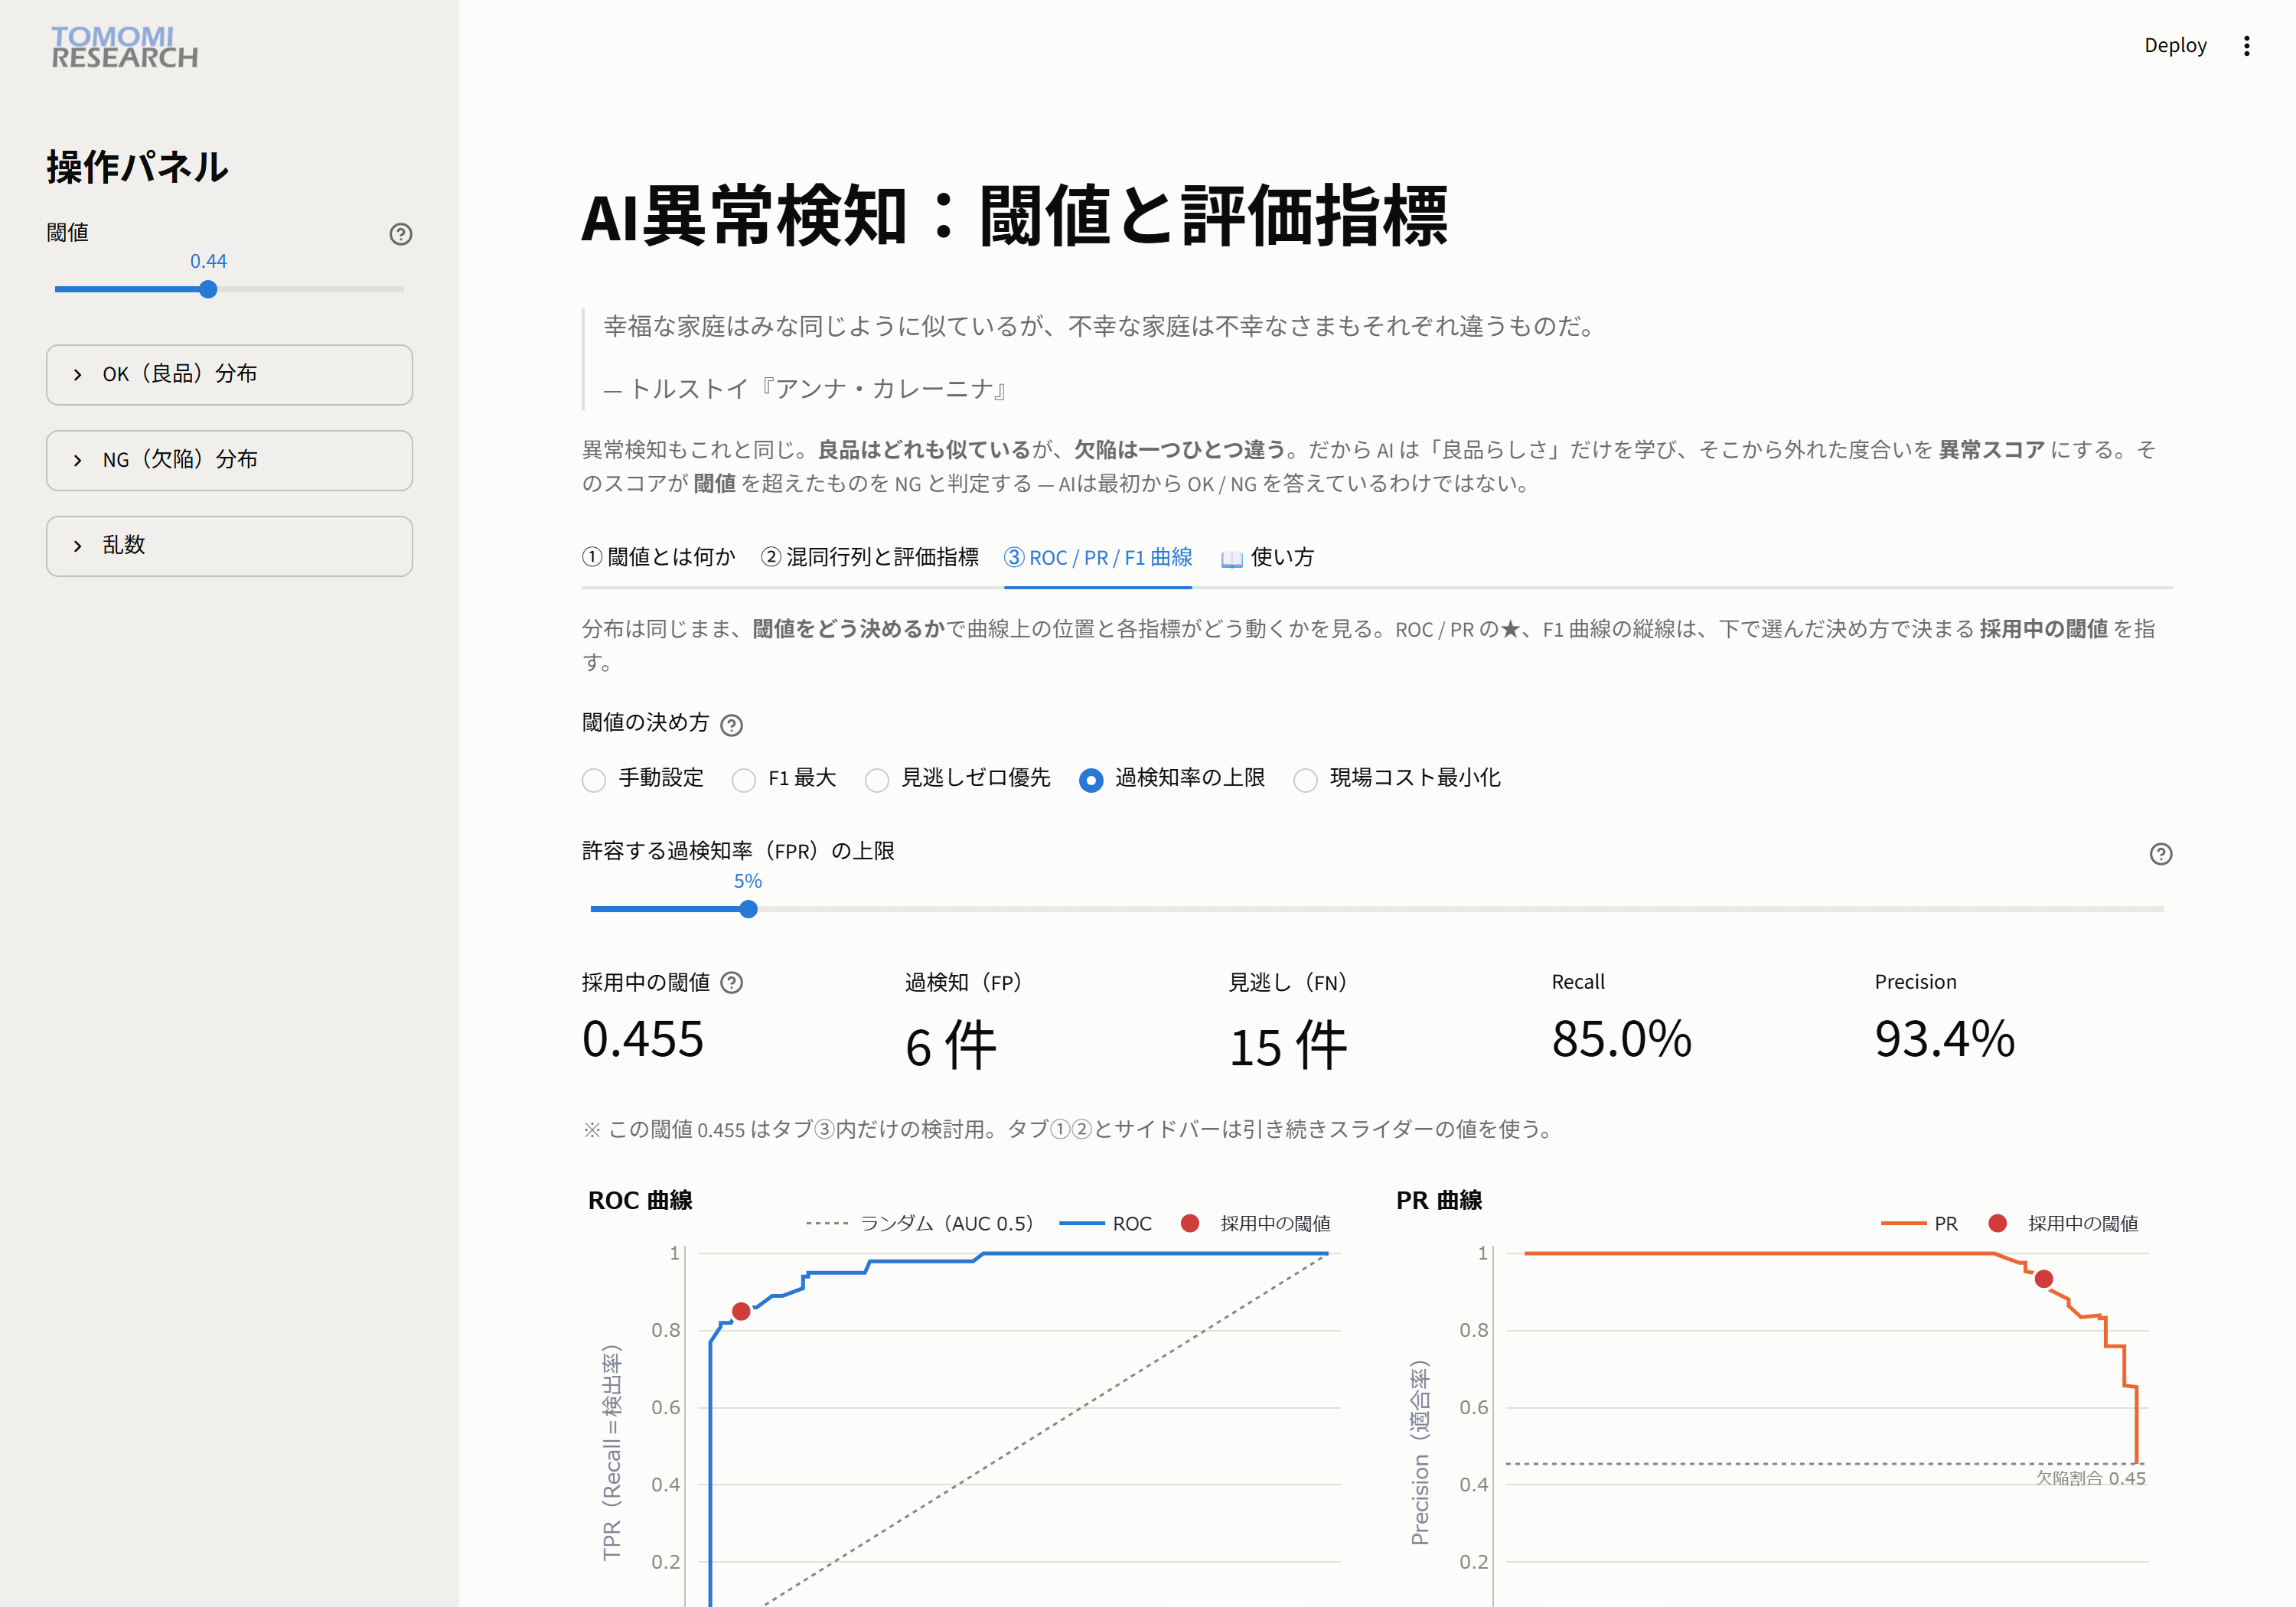
👀 Observe: set a cap of "stop no more than 5% of good parts," and the threshold becomes 0.455.
The result is stricter on false detections, with 6 false detections and Precision 93.4%, while missed defects rise to 15 (Recall 85.0%).
4. Minimize shop-floor cost
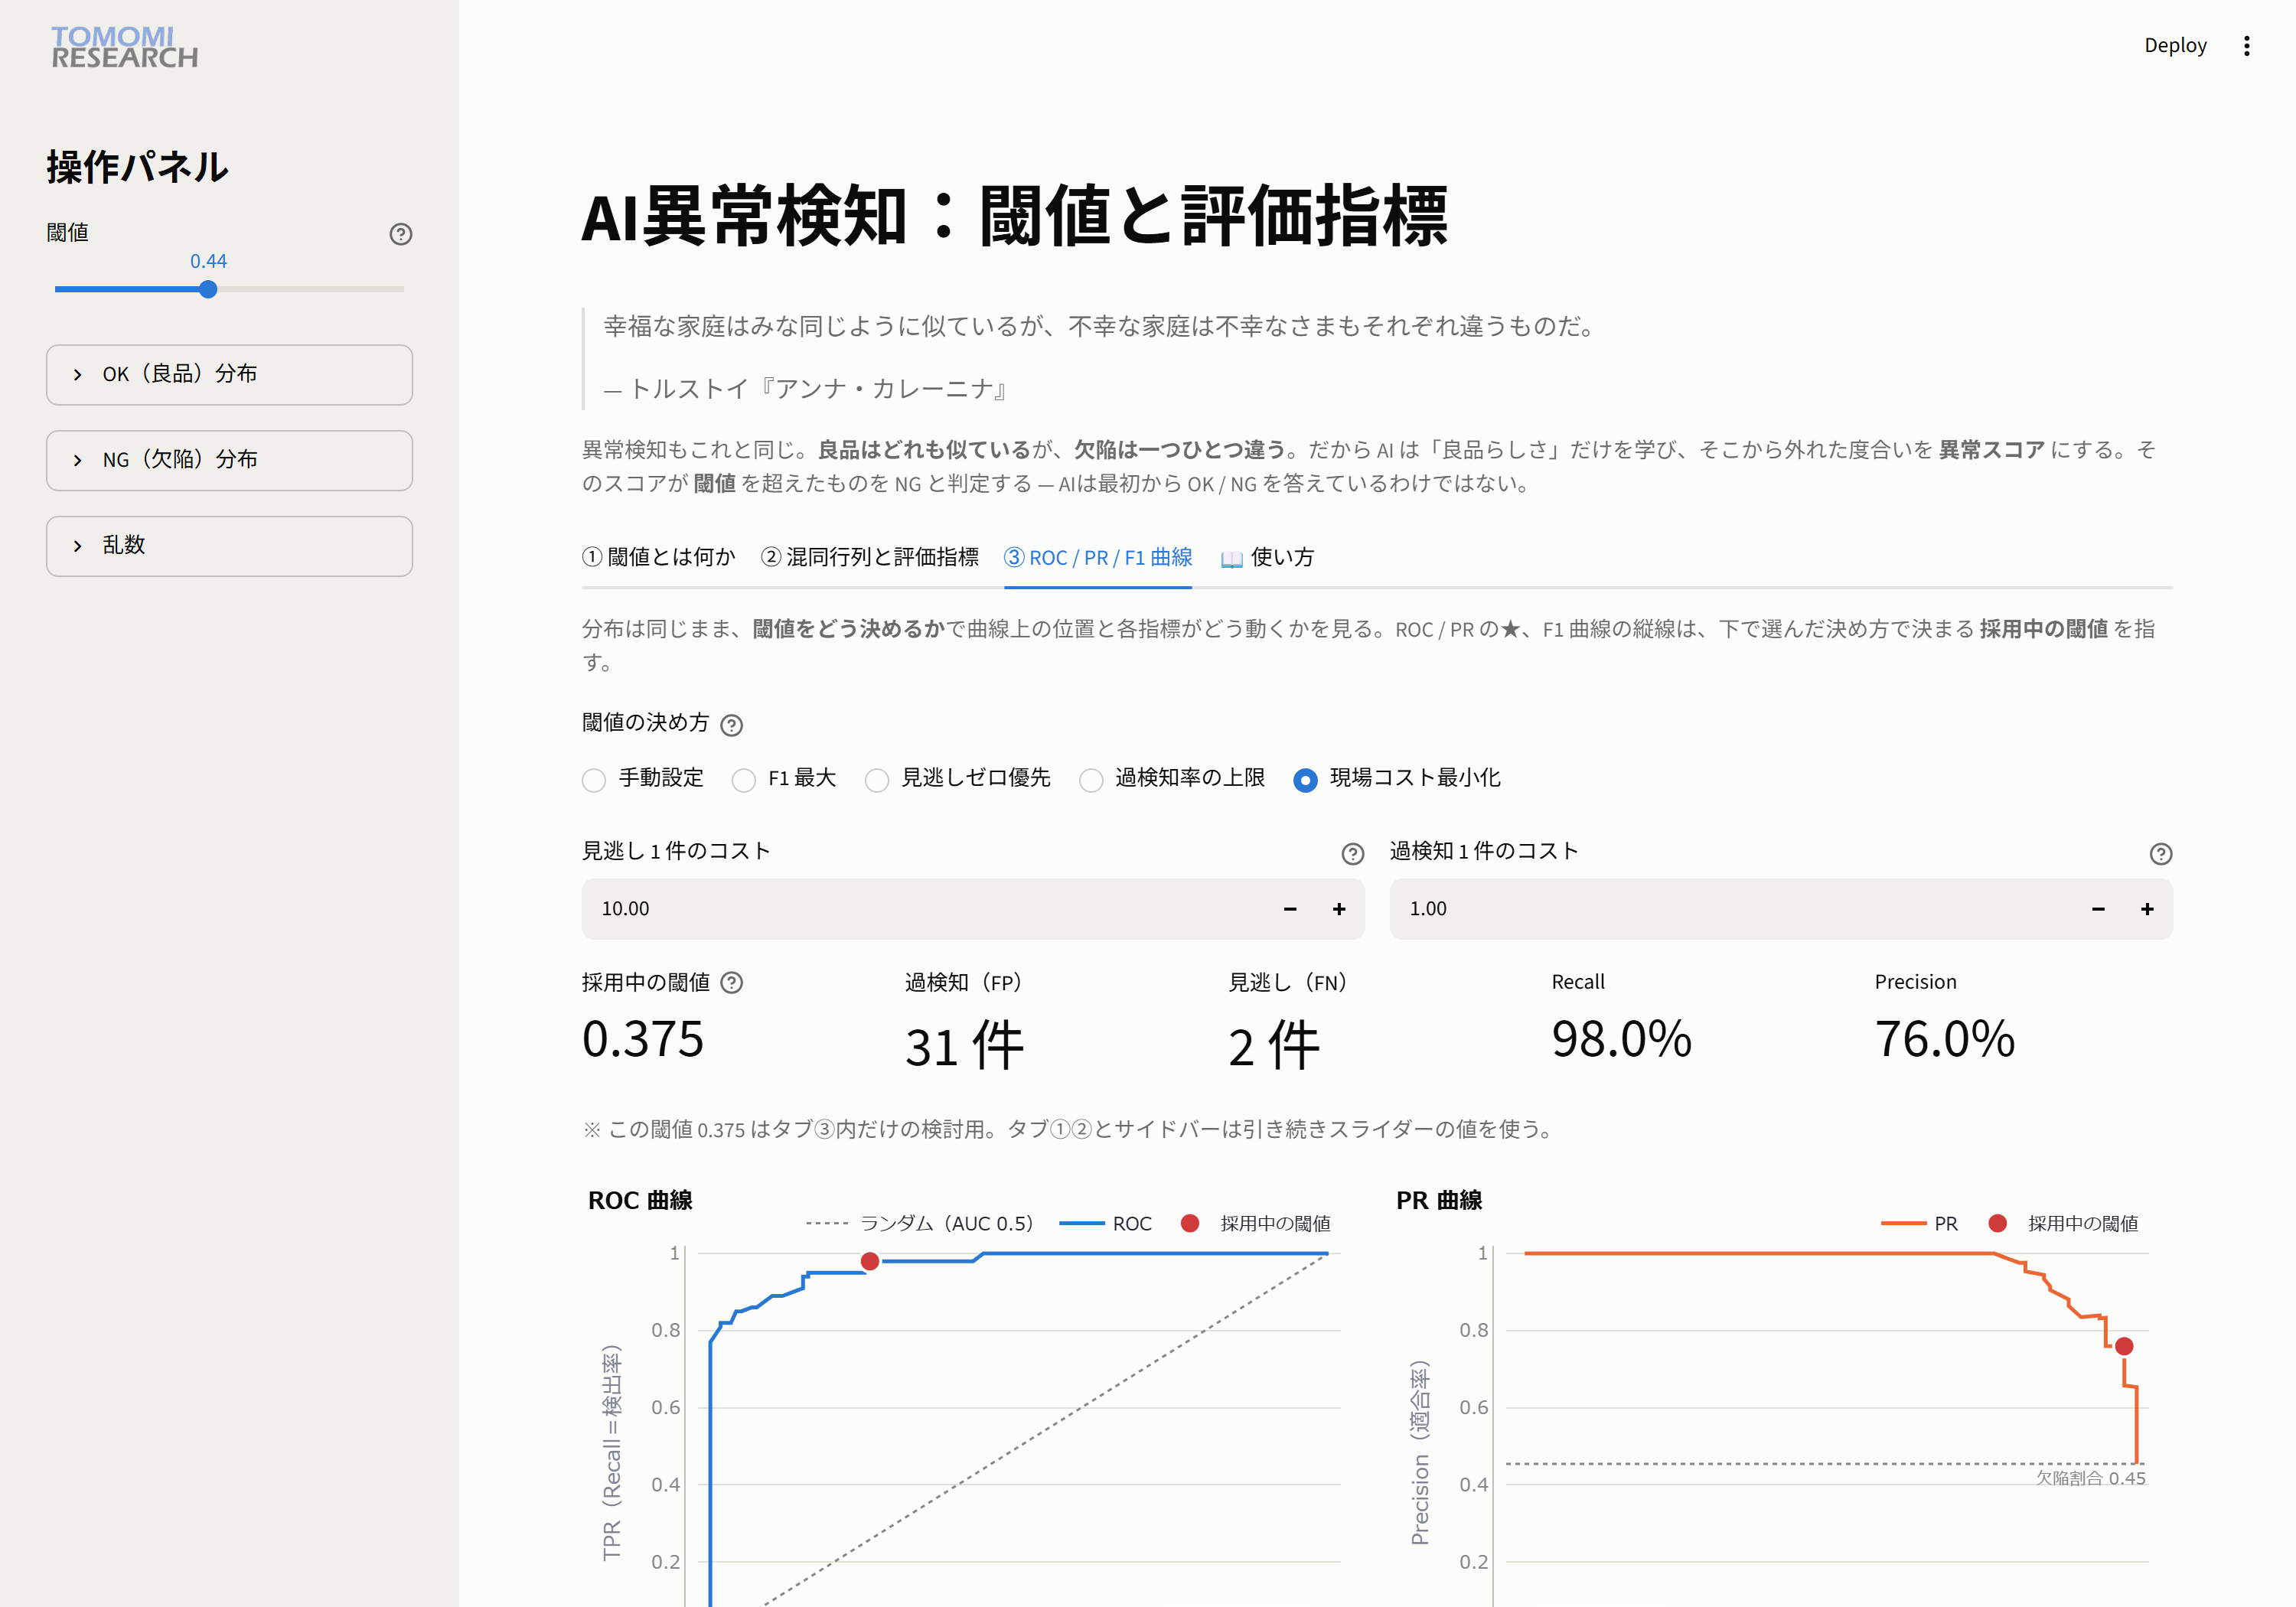
👀 Observe: set the cost of 1 missed defect = 10 and 1 false detection = 1 (a miss hurts 10 times more), and
the threshold becomes 0.375. It almost eliminates missed defects (Recall 98.0%), and in exchange accepts 31 false detections (Precision 76.0%).
The weighting of losses is reflected directly in the threshold.
Comparing the four modes (same AI, same data)
| Method | Threshold | False detections (FP) | Missed defects (FN) | Recall | Precision |
|---|---|---|---|---|---|
| F1 max | 0.465 | 5 | 15 | 85.0% | 94.4% |
| Zero misses first | 0.330 | 53 | 0 | 100% | 65.4% |
| Cost minimization (10:1) | 0.375 | 31 | 2 | 98.0% | 76.0% |
| False detection rate capped at 5% | 0.455 | 6 | 15 | 85.0% | 93.4% |
Even with the same AI and the same data, results change this much depending on the policy.
There is no "single correct threshold." Your quality policy determines the threshold.
The F1 curve: a tug-of-war between Recall and Precision
Switch back to "Manual," scroll down, and you will see the F1 curve.
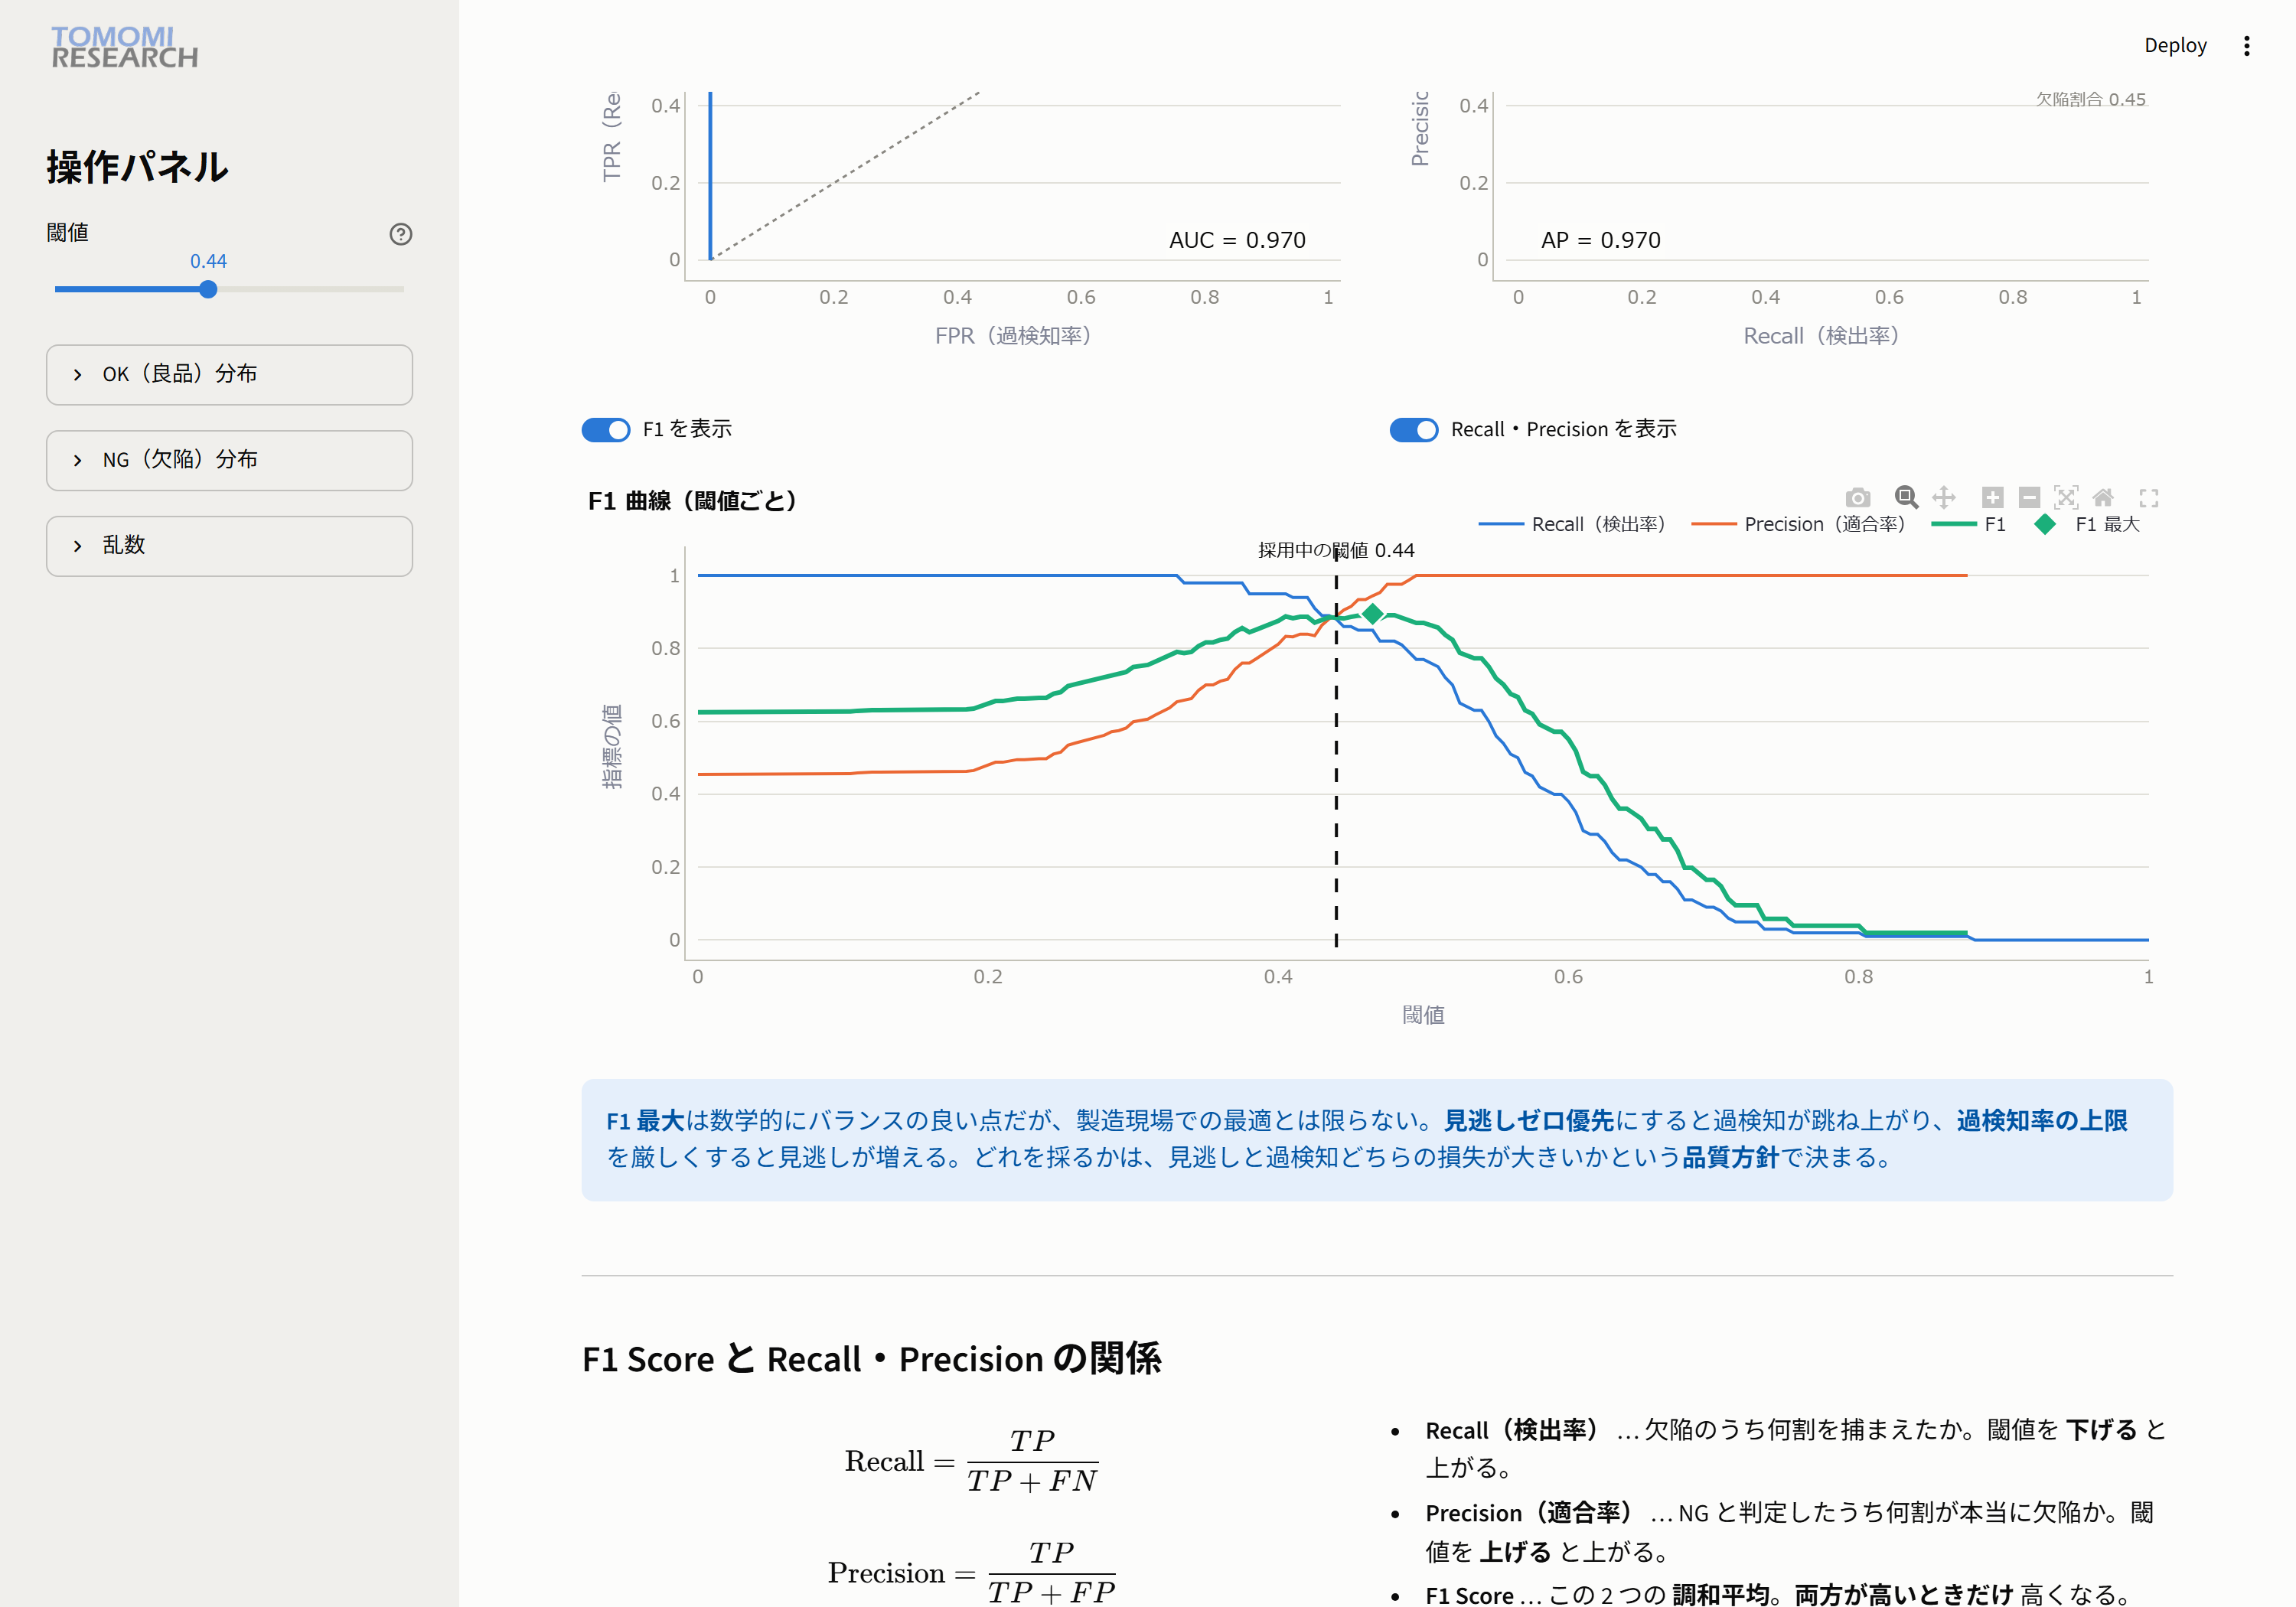
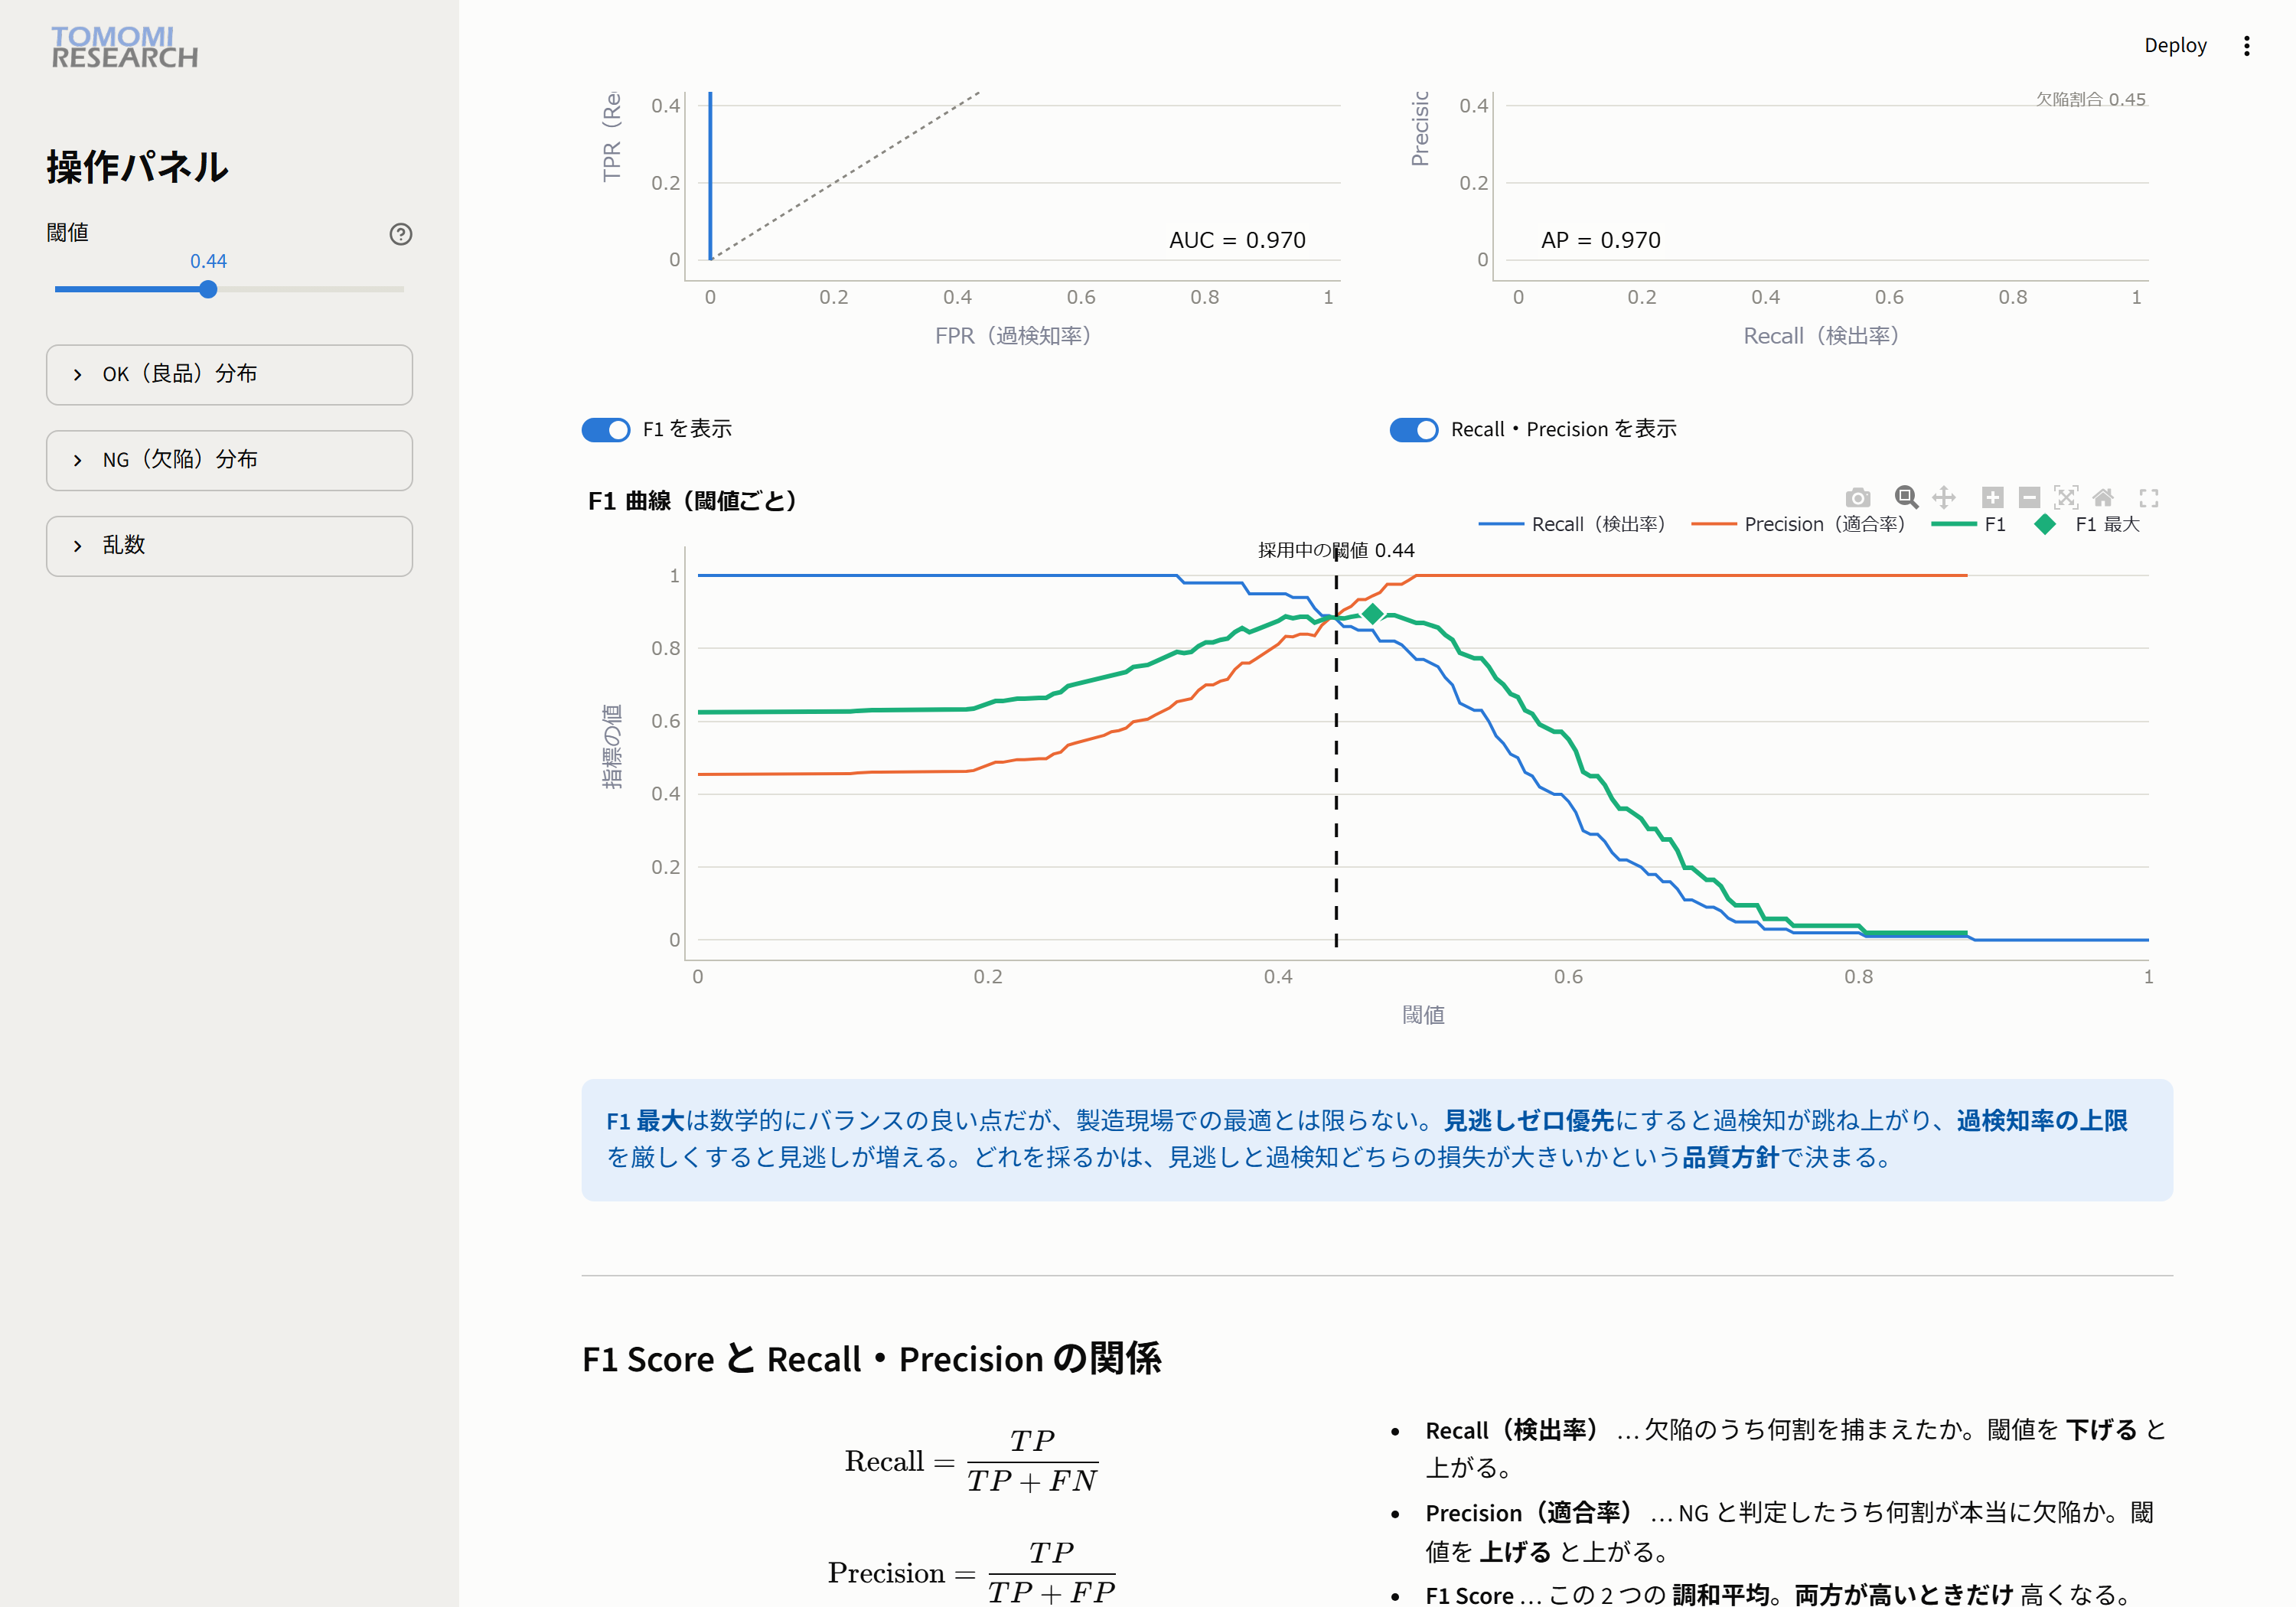
- Blue = Recall (rises as you lower the threshold) / Orange = Precision (rises as you raise the threshold)
- Green = F1. Green peaks around where blue and orange cross (the balance point, marked with a diamond).
What is the F1 Score? (formula)
F1 is the harmonic mean of Recall and Precision, so it is high only when both are high.
If one is low, F1 is pulled strongly toward the lower value rather than the average
(for example, Precision 1.0 and Recall 0.1 give an arithmetic mean of 0.55, but an F1 of only about 0.18).
That is why F1 stays low both for "zero misses but full of false detections" and for "zero false detections but full of misses."

