Anomaly Detection Trained on Good Parts — Visual Inspection Fundamentals: 10 Key Questions
 kotai2003
This is a general technical overview. It does not guarantee the functionality, detection performance, or measurement accuracy of any specific product.
Anomaly detection for visual inspection can be trained on good parts alone. The model learns what normal looks like and flags anything that deviates. That makes it a practical option when defect samples are scarce. This guide answers the 10 questions we hear most often from teams evaluating it. It covers how the approach works, how to build the training set, what you can and cannot check without defect images, how to read anomaly scores and set thresholds, and how to verify and run it on a production line.
Contents
- Basic principle
- Q01 What is anomaly detection trained on good parts?
- Q02 How does it differ from AI trained on good and defective parts, or from conventional machine vision? - Training data
- Q03 How many good-part images do I need for training?
- Q04 How should I capture and select good-part images for training? - Defects and validation
- Q05 Can I start inspection without any defect images?
- Q06 Which defects does it handle well, and which are difficult? - Anomaly score and threshold
- Q07 What do the anomaly score and heatmap mean?
- Q08 How do I set the threshold that separates good from defective? - Evaluation and operation
- Q09 How should I verify detection performance?
- Q10 What should I watch for to run it reliably on a production line?
1. Basic principle: learn what good looks like, find what's different
Start here. These two questions define what the approach does and where it sits next to the alternatives.
Q01 What is anomaly detection trained on good parts?
The model learns what good parts look like, then flags anything that deviates.
The model learns the normal shape, texture, and color of a part from images of good parts. It then measures how far an inspection image departs from those learned features and highlights candidate anomalies. Keep in mind that "different from usual" is not the same as "defective." The final accept/reject decision still has to follow your quality criteria.
- Learn — capture the features of good parts
- Inspect — measure the difference from good parts
- Judge — apply your quality criteria
Q02 How does it differ from AI trained on good and defective parts, or from conventional machine vision?
They differ in the data they need and in how the inspection criteria are built.
Good-part learning is a practical option when defect samples are scarce. Supervised learning, which uses both good and defective images, learns known defect types and classifies them. Conventional rule-based machine vision relies on engineers to define rules for brightness, dimensions, shape, and so on. These approaches can also be combined to suit the application.
- Good-part learning — finds deviations from normal
- Supervised learning — learns from labeled examples
- Rule-based machine vision — engineers design the inspection rules
2. Training data: coverage over count
What goes into the training set shapes the result. The key question is not how many images you have, but how much acceptable normal variation they cover.
Q03 How many good-part images do I need for training?
It depends on how much your good parts vary and on what you are inspecting.
There is no universal number that is "enough." Rather than adding more near-identical images of the same item, collect the acceptable variation: lot-to-lot differences, color variation, surface texture, and so on. Use the results of an initial evaluation to add the conditions that are missing, and confirm on a separate, held-out evaluation set that performance actually improves.
- Image count — varies by part and method
- Diversity — cover all acceptable normal variation
- When to add more — evaluate on images not used for training
Q04 How should I capture and select good-part images for training?
Stabilize the imaging setup and select only images that meet your quality standard.
Start from the same lighting, focus, field of view, and resolution as production, and minimize unnecessary positional shifts and background changes. Use images that quality staff have confirmed as good, so that no defects slip into the training set. Include acceptable variation, but manage ambiguous borderline parts separately, and make sure images of the same physical part do not end up in the evaluation set as well.
- Imaging — match production conditions
- Selection — share a common definition of "good"
- Splitting — separate by individual part and by lot
Note: The data preparation steps in this section describe a typical approach for an initial on-site evaluation.
3. Defects and validation: train without defects, validate with them
Training on good parts alone is possible. Checking for escapes without defects is not. This section separates the two, then looks at which defects suit the approach.
Q05 Can I start inspection without any defect images?
You can start training. To check for escapes, you need real defects.
You can build a model from good parts alone and measure how often good parts are wrongly flagged as defective. However, you cannot evaluate the miss rate without defective samples. Synthetic defect images are useful for preliminary evaluation, but they do not necessarily represent real defects and cannot replace verification with actual defective parts.
- Good parts only — training and false-positive checks
- Synthetic defects — help prepare the evaluation
- Real defects — confirm they are actually detected
Q06 Which defects does it handle well, and which are difficult?
It targets defects that show a clear difference from good parts in the image.
It may be able to detect scratches, stains, chips, foreign matter, and similar defects. On the other hand, defects that do not appear in the image, tiny defects that disappear when the image is downscaled, and defects that resemble the normal surface pattern are harder. Whether it can handle anomalies such as wrong counts or wrong ordering also depends on the method. First, make sure you have lighting that reveals the defect and sufficient resolution.
- Easier cases — clear difference from normal
- Harder cases — tiny or low-contrast defects
- First check — is the defect visible in the raw image?
4. Anomaly score and threshold: turn anomaly strength into a decision
The model's output is not a pass/fail result on its own. You read the anomaly score and heatmap, then set a threshold that turns them into a decision.
Q07 What do the anomaly score and heatmap mean?
They show how strongly, and where, an image deviates from good parts.
The anomaly score expresses the degree of abnormality for the image as a whole (or a similar unit), while the heatmap shows the degree of abnormality at each location in color. The score is generally not a probability of being defective. Nor do the red areas explain the type or root cause of a defect. The numerical scale and color mapping vary with the model and display settings.
- Anomaly score — how far it deviates
- Heatmap — where it deviates
- How to read it — not a probability, not a root cause
Q08 How do I set the threshold that separates good from defective?
Check misses and false positives on images that were not used for training.
Lowering the threshold generally catches smaller anomalies but also increases false positives on good parts. Raising it tends to reduce false positives but may increase escapes. Review the score distributions of good and defective parts and set the threshold to match your quality requirements. If the two distributions overlap, revisit the imaging setup and the training as well.
- Lower threshold — catches more; watch for overkill
- Higher threshold — passes more; watch for escapes
- Deciding factor — your production quality requirements
Note: Keep the images used to tune the threshold separate from the images used to confirm final performance.
5. Evaluation and operation: miss rate, false positive rate, and running on the line
The last two questions cover how to verify performance and how to keep it reliable once it is in production.
Q09 How should I verify detection performance?
Check the miss rate and the false positive rate, together with the actual counts.
Evaluate on images that were not used for training or threshold tuning. Miss rate = defects missed ÷ actual defects. False positive rate = good parts flagged as defective ÷ actual good parts. Also break the results down by defect type, size, and lot. Zero misses in a small test does not guarantee zero misses in the future.
- Evaluate with defects — miss rate by defect type
- Evaluate with good parts — false positive rate on good parts
- Record the results — rates, counts, and test conditions
Q10 What should I watch for to run it reliably on a production line?
Monitor imaging conditions and inspection results, and re-evaluate after any change.
Confirm that the full sequence of capture, transfer, inference, judgment, and rejection fits within the required cycle time. Also watch for lighting degradation, dirty lenses, and changes in material or product variant. Do not automatically retrain on false-positive images as "good"; add them only after quality review, and compare the model before and after the update on the same evaluation data.
- Speed — check timing across the whole process
- Change — monitor imaging, materials, and product variants
- Updates — quality review → retrain → evaluate
Note: The operating procedure in this section is a general recommendation.
Key takeaways
- "Different" is not the same as "defective." Anomaly scores and heatmaps show deviation from good parts. Your quality criteria decide pass or fail.
- Coverage, imaging, and data splits matter more than image count. Capture under production conditions, cover acceptable normal variation, and keep training, threshold-tuning, and final evaluation images separate.
- Verify with real defects and held-out images. You cannot measure the miss rate without real defects, and synthetic defects do not replace that check. Once in production, re-evaluate whenever conditions change.
Related articles
- Synthetic Defects — Visual Inspection Fundamentals: 10 Key Questions — how synthetic defect images are made, and how they are used for training and evaluation prep (see Q05)
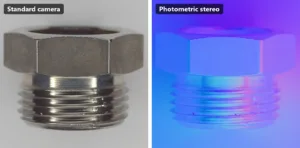
- Photometric Stereo — Visual Inspection Fundamentals: 10 Key Questions — a closer look at lighting that reveals the defect (see Q06)
We are also running this theme as a five-part series on our LinkedIn and X channels.
Anomaly detection software from TOMOMI RESEARCH
E3 ENGINE® is our anomaly detection engine based on learning from good parts. If you want to check the points in this guide against your own parts and imaging conditions, talk to us about how to run a check with real samples.
- Learn more about E3 ENGINE®: https://www.tomomi-research.com/en/e3engine
- Contact us: https://www.tomomi-research.com/en/contact
This is a general technical overview. It does not guarantee the functionality, detection performance, or measurement accuracy of any specific product.
See what you need to see. — TOMOMI RESEARCH, INC.